Immigrants from Korea vs French In Labor Force | Age 35-44
COMPARE
Immigrants from Korea
French
In Labor Force | Age 35-44
In Labor Force | Age 35-44 Comparison
Immigrants from Korea
French
84.6%
IN LABOR FORCE | AGE 35-44
88.2/ 100
METRIC RATING
134th/ 347
METRIC RANK
84.0%
IN LABOR FORCE | AGE 35-44
7.5/ 100
METRIC RATING
220th/ 347
METRIC RANK
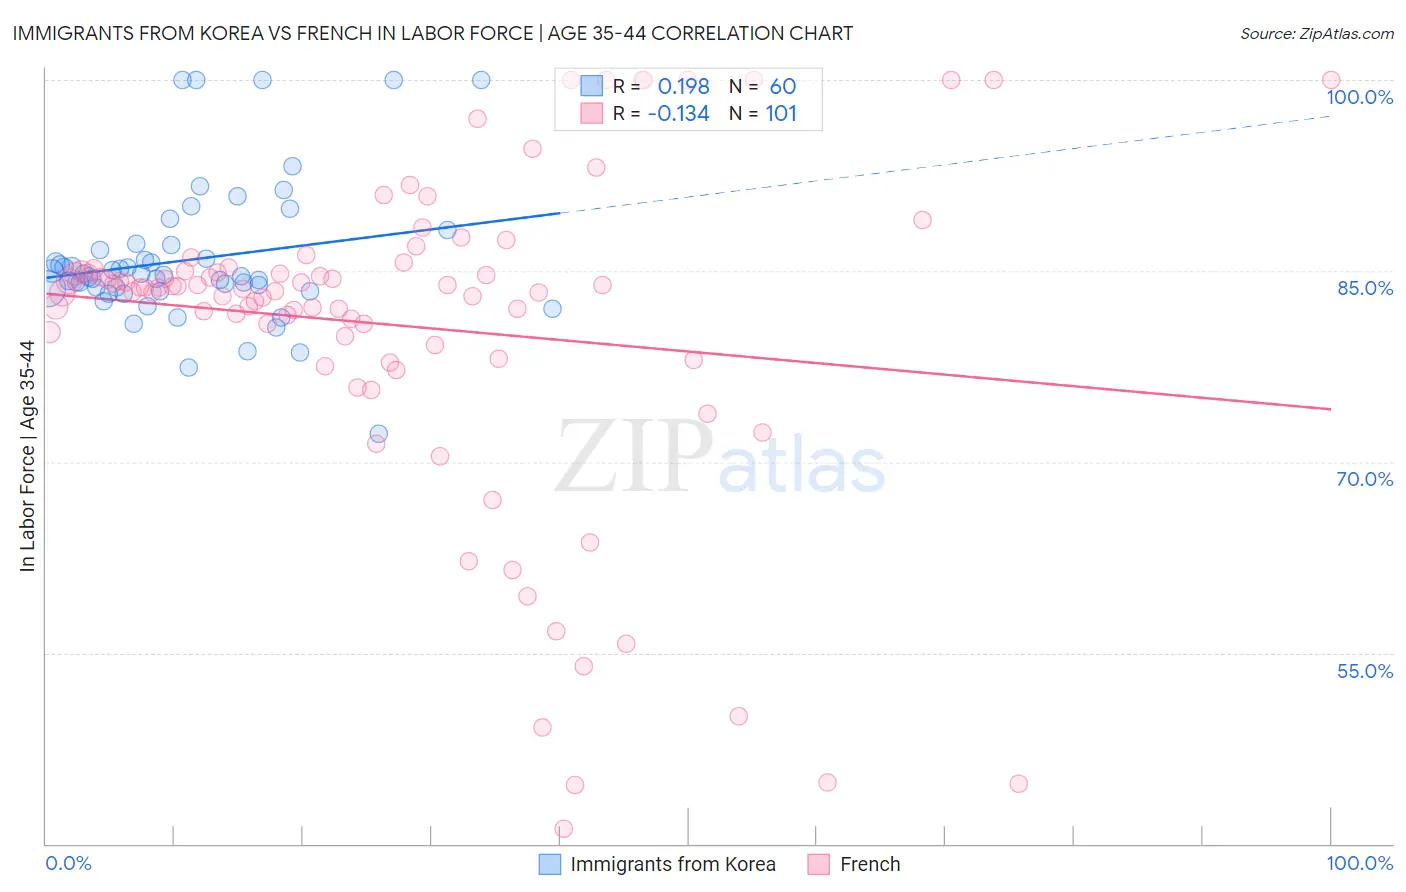
Immigrants from Korea vs French In Labor Force | Age 35-44 Correlation Chart
The statistical analysis conducted on geographies consisting of 416,059,040 people shows a poor positive correlation between the proportion of Immigrants from Korea and labor force participation rate among population between the ages 35 and 44 in the United States with a correlation coefficient (R) of 0.198 and weighted average of 84.6%. Similarly, the statistical analysis conducted on geographies consisting of 571,709,167 people shows a poor negative correlation between the proportion of French and labor force participation rate among population between the ages 35 and 44 in the United States with a correlation coefficient (R) of -0.134 and weighted average of 84.0%, a difference of 0.74%.
In Labor Force | Age 35-44 Correlation Summary
| Measurement | Immigrants from Korea | French |
| Minimum | 72.2% | 41.2% |
| Maximum | 100.0% | 100.0% |
| Range | 27.8% | 58.8% |
| Mean | 85.9% | 80.7% |
| Median | 84.6% | 83.7% |
| Interquartile 25% (IQ1) | 83.5% | 78.6% |
| Interquartile 75% (IQ3) | 86.9% | 85.1% |
| Interquartile Range (IQR) | 3.3% | 6.4% |
| Standard Deviation (Sample) | 5.5% | 12.8% |
| Standard Deviation (Population) | 5.4% | 12.8% |
Similar Demographics by In Labor Force | Age 35-44
Demographics Similar to Immigrants from Korea by In Labor Force | Age 35-44
In terms of in labor force | age 35-44, the demographic groups most similar to Immigrants from Korea are Argentinean (84.6%, a difference of 0.0%), Immigrants from Malaysia (84.6%, a difference of 0.010%), Palestinian (84.7%, a difference of 0.020%), Bhutanese (84.7%, a difference of 0.020%), and Immigrants from Scotland (84.7%, a difference of 0.020%).
| Demographics | Rating | Rank | In Labor Force | Age 35-44 |
| Immigrants | Spain | 90.6 /100 | #127 | Exceptional 84.7% |
| Immigrants | Ghana | 90.4 /100 | #128 | Exceptional 84.7% |
| Palestinians | 89.7 /100 | #129 | Excellent 84.7% |
| Bhutanese | 89.7 /100 | #130 | Excellent 84.7% |
| Immigrants | Scotland | 89.6 /100 | #131 | Excellent 84.7% |
| Austrians | 89.4 /100 | #132 | Excellent 84.7% |
| Argentineans | 88.4 /100 | #133 | Excellent 84.6% |
| Immigrants | Korea | 88.2 /100 | #134 | Excellent 84.6% |
| Immigrants | Malaysia | 87.5 /100 | #135 | Excellent 84.6% |
| Afghans | 86.3 /100 | #136 | Excellent 84.6% |
| Immigrants | Chile | 84.6 /100 | #137 | Excellent 84.6% |
| Czechoslovakians | 82.6 /100 | #138 | Excellent 84.6% |
| Immigrants | Zaire | 82.5 /100 | #139 | Excellent 84.6% |
| Immigrants | Japan | 81.4 /100 | #140 | Excellent 84.6% |
| Immigrants | Belgium | 80.8 /100 | #141 | Excellent 84.6% |
Demographics Similar to French by In Labor Force | Age 35-44
In terms of in labor force | age 35-44, the demographic groups most similar to French are Icelander (84.0%, a difference of 0.020%), Assyrian/Chaldean/Syriac (84.0%, a difference of 0.020%), Immigrants from Panama (84.0%, a difference of 0.030%), Immigrants from Nicaragua (84.1%, a difference of 0.040%), and Subsaharan African (84.1%, a difference of 0.040%).
| Demographics | Rating | Rank | In Labor Force | Age 35-44 |
| Bangladeshis | 13.7 /100 | #213 | Poor 84.1% |
| Immigrants | Barbados | 13.2 /100 | #214 | Poor 84.1% |
| Europeans | 12.2 /100 | #215 | Poor 84.1% |
| Nicaraguans | 12.1 /100 | #216 | Poor 84.1% |
| Immigrants | Norway | 11.7 /100 | #217 | Poor 84.1% |
| Immigrants | Nicaragua | 9.4 /100 | #218 | Tragic 84.1% |
| Sub-Saharan Africans | 9.3 /100 | #219 | Tragic 84.1% |
| French | 7.5 /100 | #220 | Tragic 84.0% |
| Icelanders | 6.7 /100 | #221 | Tragic 84.0% |
| Assyrians/Chaldeans/Syriacs | 6.6 /100 | #222 | Tragic 84.0% |
| Immigrants | Panama | 6.4 /100 | #223 | Tragic 84.0% |
| U.S. Virgin Islanders | 6.1 /100 | #224 | Tragic 84.0% |
| Immigrants | Burma/Myanmar | 6.1 /100 | #225 | Tragic 84.0% |
| Panamanians | 5.4 /100 | #226 | Tragic 84.0% |
| British West Indians | 5.3 /100 | #227 | Tragic 84.0% |