Romanian vs Zimbabwean In Labor Force | Age 35-44
COMPARE
Romanian
Zimbabwean
In Labor Force | Age 35-44
In Labor Force | Age 35-44 Comparison
Romanians
Zimbabweans
84.5%
IN LABOR FORCE | AGE 35-44
72.1/ 100
METRIC RATING
151st/ 347
METRIC RANK
86.1%
IN LABOR FORCE | AGE 35-44
100.0/ 100
METRIC RATING
5th/ 347
METRIC RANK
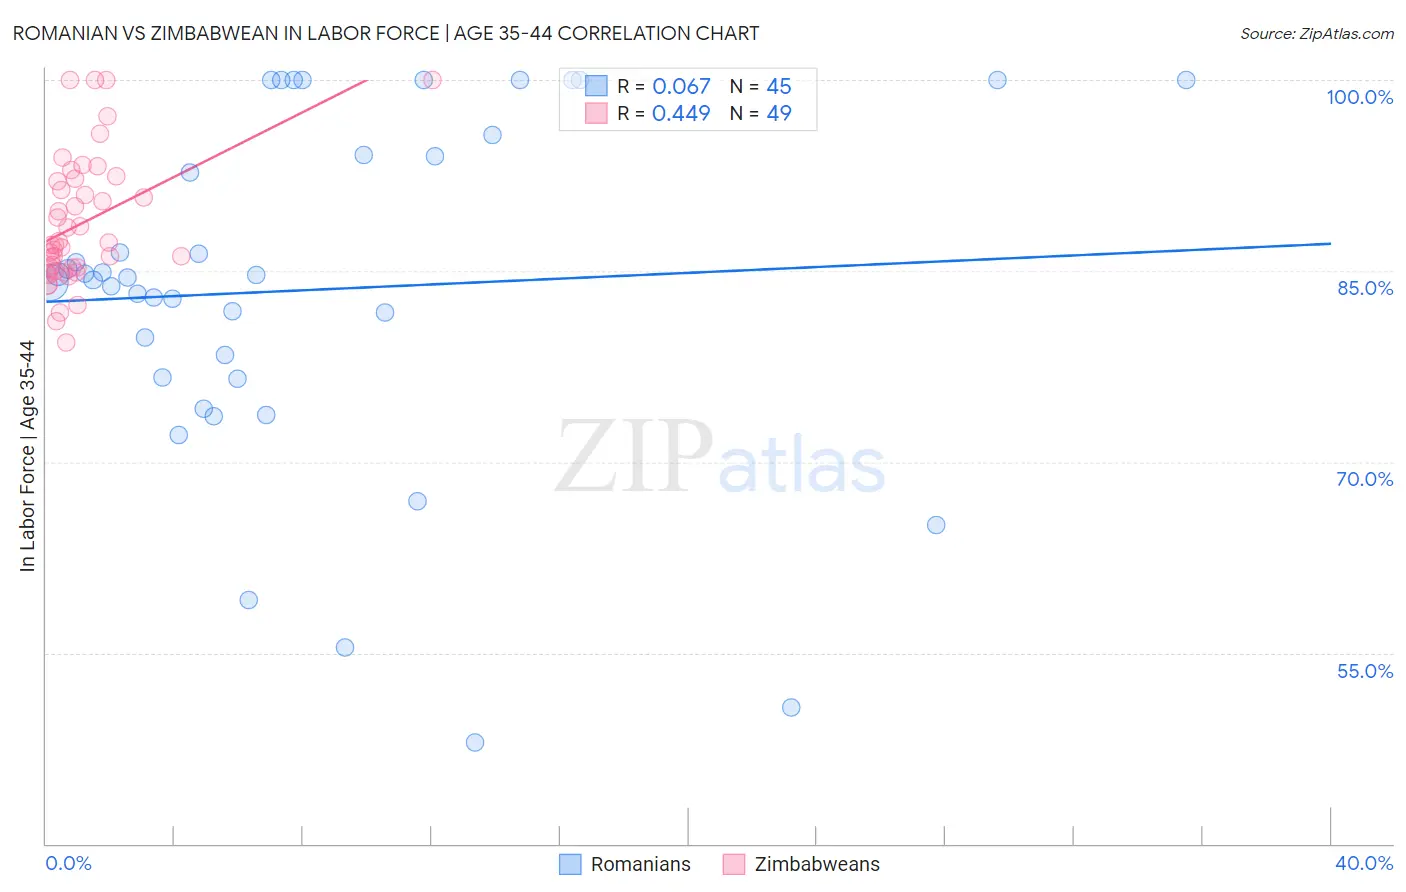
Romanian vs Zimbabwean In Labor Force | Age 35-44 Correlation Chart
The statistical analysis conducted on geographies consisting of 377,740,706 people shows a slight positive correlation between the proportion of Romanians and labor force participation rate among population between the ages 35 and 44 in the United States with a correlation coefficient (R) of 0.067 and weighted average of 84.5%. Similarly, the statistical analysis conducted on geographies consisting of 69,188,231 people shows a moderate positive correlation between the proportion of Zimbabweans and labor force participation rate among population between the ages 35 and 44 in the United States with a correlation coefficient (R) of 0.449 and weighted average of 86.1%, a difference of 1.9%.
In Labor Force | Age 35-44 Correlation Summary
| Measurement | Romanian | Zimbabwean |
| Minimum | 48.0% | 79.4% |
| Maximum | 100.0% | 100.0% |
| Range | 52.0% | 20.6% |
| Mean | 83.5% | 88.7% |
| Median | 84.5% | 87.0% |
| Interquartile 25% (IQ1) | 76.6% | 85.1% |
| Interquartile 75% (IQ3) | 94.9% | 92.1% |
| Interquartile Range (IQR) | 18.3% | 7.0% |
| Standard Deviation (Sample) | 13.6% | 5.1% |
| Standard Deviation (Population) | 13.4% | 5.0% |
Similar Demographics by In Labor Force | Age 35-44
Demographics Similar to Romanians by In Labor Force | Age 35-44
In terms of in labor force | age 35-44, the demographic groups most similar to Romanians are South American Indian (84.5%, a difference of 0.010%), Okinawan (84.5%, a difference of 0.010%), Immigrants from Nigeria (84.5%, a difference of 0.010%), Immigrants from Taiwan (84.5%, a difference of 0.010%), and Trinidadian and Tobagonian (84.5%, a difference of 0.020%).
| Demographics | Rating | Rank | In Labor Force | Age 35-44 |
| Immigrants | Jamaica | 79.4 /100 | #144 | Good 84.6% |
| Immigrants | Saudi Arabia | 79.4 /100 | #145 | Good 84.6% |
| Immigrants | Asia | 78.7 /100 | #146 | Good 84.5% |
| Immigrants | Netherlands | 76.6 /100 | #147 | Good 84.5% |
| South American Indians | 73.6 /100 | #148 | Good 84.5% |
| Okinawans | 73.5 /100 | #149 | Good 84.5% |
| Immigrants | Nigeria | 73.3 /100 | #150 | Good 84.5% |
| Romanians | 72.1 /100 | #151 | Good 84.5% |
| Immigrants | Taiwan | 71.4 /100 | #152 | Good 84.5% |
| Trinidadians and Tobagonians | 69.5 /100 | #153 | Good 84.5% |
| Iranians | 69.4 /100 | #154 | Good 84.5% |
| Immigrants | Switzerland | 65.9 /100 | #155 | Good 84.5% |
| Immigrants | Israel | 64.3 /100 | #156 | Good 84.4% |
| Immigrants | Austria | 63.8 /100 | #157 | Good 84.4% |
| Jamaicans | 62.7 /100 | #158 | Good 84.4% |
Demographics Similar to Zimbabweans by In Labor Force | Age 35-44
In terms of in labor force | age 35-44, the demographic groups most similar to Zimbabweans are Bolivian (86.1%, a difference of 0.010%), Immigrants from Sierra Leone (86.1%, a difference of 0.050%), Immigrants from Cabo Verde (86.2%, a difference of 0.13%), Immigrants from Bolivia (86.2%, a difference of 0.16%), and Immigrants from Ethiopia (85.9%, a difference of 0.22%).
| Demographics | Rating | Rank | In Labor Force | Age 35-44 |
| Sierra Leoneans | 100.0 /100 | #1 | Exceptional 86.4% |
| Luxembourgers | 100.0 /100 | #2 | Exceptional 86.4% |
| Immigrants | Bolivia | 100.0 /100 | #3 | Exceptional 86.2% |
| Immigrants | Cabo Verde | 100.0 /100 | #4 | Exceptional 86.2% |
| Zimbabweans | 100.0 /100 | #5 | Exceptional 86.1% |
| Bolivians | 100.0 /100 | #6 | Exceptional 86.1% |
| Immigrants | Sierra Leone | 100.0 /100 | #7 | Exceptional 86.1% |
| Immigrants | Ethiopia | 100.0 /100 | #8 | Exceptional 85.9% |
| Ethiopians | 100.0 /100 | #9 | Exceptional 85.9% |
| Cape Verdeans | 100.0 /100 | #10 | Exceptional 85.8% |
| Immigrants | Cameroon | 100.0 /100 | #11 | Exceptional 85.8% |
| Liberians | 100.0 /100 | #12 | Exceptional 85.7% |
| Somalis | 100.0 /100 | #13 | Exceptional 85.6% |
| Immigrants | Somalia | 100.0 /100 | #14 | Exceptional 85.6% |
| Norwegians | 100.0 /100 | #15 | Exceptional 85.6% |