Kenyan vs Zimbabwean In Labor Force | Age 35-44
COMPARE
Kenyan
Zimbabwean
In Labor Force | Age 35-44
In Labor Force | Age 35-44 Comparison
Kenyans
Zimbabweans
85.2%
IN LABOR FORCE | AGE 35-44
99.8/ 100
METRIC RATING
37th/ 347
METRIC RANK
86.1%
IN LABOR FORCE | AGE 35-44
100.0/ 100
METRIC RATING
5th/ 347
METRIC RANK
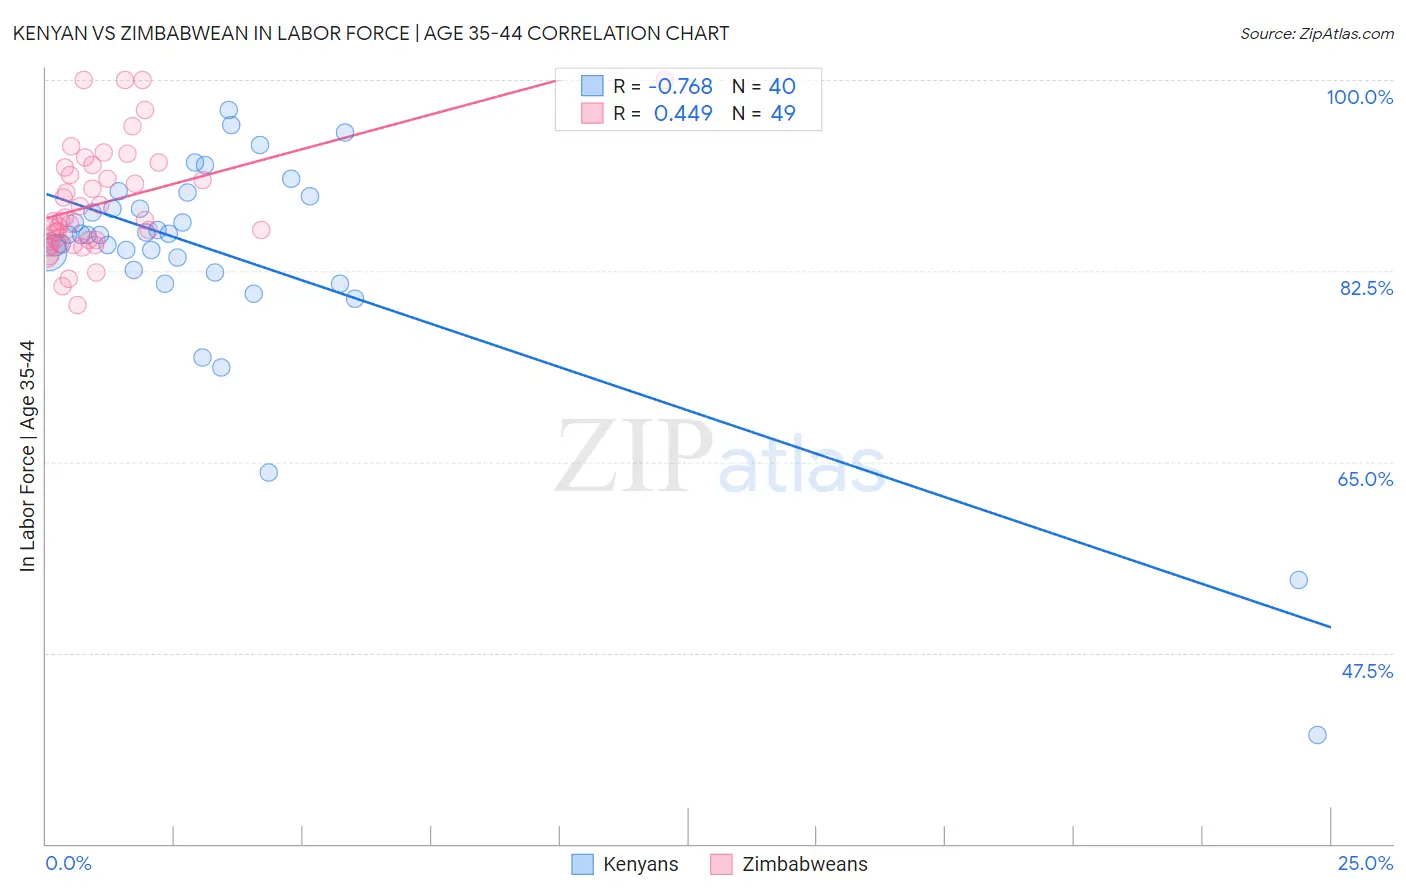
Kenyan vs Zimbabwean In Labor Force | Age 35-44 Correlation Chart
The statistical analysis conducted on geographies consisting of 168,197,384 people shows a strong negative correlation between the proportion of Kenyans and labor force participation rate among population between the ages 35 and 44 in the United States with a correlation coefficient (R) of -0.768 and weighted average of 85.2%. Similarly, the statistical analysis conducted on geographies consisting of 69,188,231 people shows a moderate positive correlation between the proportion of Zimbabweans and labor force participation rate among population between the ages 35 and 44 in the United States with a correlation coefficient (R) of 0.449 and weighted average of 86.1%, a difference of 1.0%.
In Labor Force | Age 35-44 Correlation Summary
| Measurement | Kenyan | Zimbabwean |
| Minimum | 40.0% | 79.4% |
| Maximum | 97.2% | 100.0% |
| Range | 57.2% | 20.6% |
| Mean | 83.8% | 88.7% |
| Median | 85.8% | 87.0% |
| Interquartile 25% (IQ1) | 82.5% | 85.1% |
| Interquartile 75% (IQ3) | 88.8% | 92.1% |
| Interquartile Range (IQR) | 6.3% | 7.0% |
| Standard Deviation (Sample) | 10.6% | 5.1% |
| Standard Deviation (Population) | 10.5% | 5.0% |
Similar Demographics by In Labor Force | Age 35-44
Demographics Similar to Kenyans by In Labor Force | Age 35-44
In terms of in labor force | age 35-44, the demographic groups most similar to Kenyans are Immigrants from Morocco (85.2%, a difference of 0.010%), Immigrants from Poland (85.2%, a difference of 0.010%), Eastern European (85.2%, a difference of 0.010%), Immigrants from Bulgaria (85.2%, a difference of 0.020%), and Immigrants from Zimbabwe (85.2%, a difference of 0.020%).
| Demographics | Rating | Rank | In Labor Force | Age 35-44 |
| Bermudans | 99.9 /100 | #30 | Exceptional 85.3% |
| Czechs | 99.9 /100 | #31 | Exceptional 85.3% |
| Immigrants | India | 99.9 /100 | #32 | Exceptional 85.3% |
| Ugandans | 99.9 /100 | #33 | Exceptional 85.3% |
| Immigrants | Nepal | 99.9 /100 | #34 | Exceptional 85.3% |
| Estonians | 99.9 /100 | #35 | Exceptional 85.3% |
| Immigrants | Morocco | 99.8 /100 | #36 | Exceptional 85.2% |
| Kenyans | 99.8 /100 | #37 | Exceptional 85.2% |
| Immigrants | Poland | 99.8 /100 | #38 | Exceptional 85.2% |
| Eastern Europeans | 99.8 /100 | #39 | Exceptional 85.2% |
| Immigrants | Bulgaria | 99.8 /100 | #40 | Exceptional 85.2% |
| Immigrants | Zimbabwe | 99.8 /100 | #41 | Exceptional 85.2% |
| Macedonians | 99.8 /100 | #42 | Exceptional 85.2% |
| Poles | 99.8 /100 | #43 | Exceptional 85.2% |
| Lithuanians | 99.8 /100 | #44 | Exceptional 85.2% |
Demographics Similar to Zimbabweans by In Labor Force | Age 35-44
In terms of in labor force | age 35-44, the demographic groups most similar to Zimbabweans are Bolivian (86.1%, a difference of 0.010%), Immigrants from Sierra Leone (86.1%, a difference of 0.050%), Immigrants from Cabo Verde (86.2%, a difference of 0.13%), Immigrants from Bolivia (86.2%, a difference of 0.16%), and Immigrants from Ethiopia (85.9%, a difference of 0.22%).
| Demographics | Rating | Rank | In Labor Force | Age 35-44 |
| Sierra Leoneans | 100.0 /100 | #1 | Exceptional 86.4% |
| Luxembourgers | 100.0 /100 | #2 | Exceptional 86.4% |
| Immigrants | Bolivia | 100.0 /100 | #3 | Exceptional 86.2% |
| Immigrants | Cabo Verde | 100.0 /100 | #4 | Exceptional 86.2% |
| Zimbabweans | 100.0 /100 | #5 | Exceptional 86.1% |
| Bolivians | 100.0 /100 | #6 | Exceptional 86.1% |
| Immigrants | Sierra Leone | 100.0 /100 | #7 | Exceptional 86.1% |
| Immigrants | Ethiopia | 100.0 /100 | #8 | Exceptional 85.9% |
| Ethiopians | 100.0 /100 | #9 | Exceptional 85.9% |
| Cape Verdeans | 100.0 /100 | #10 | Exceptional 85.8% |
| Immigrants | Cameroon | 100.0 /100 | #11 | Exceptional 85.8% |
| Liberians | 100.0 /100 | #12 | Exceptional 85.7% |
| Somalis | 100.0 /100 | #13 | Exceptional 85.6% |
| Immigrants | Somalia | 100.0 /100 | #14 | Exceptional 85.6% |
| Norwegians | 100.0 /100 | #15 | Exceptional 85.6% |