Immigrants from Korea vs Paiute In Labor Force | Age 35-44
COMPARE
Immigrants from Korea
Paiute
In Labor Force | Age 35-44
In Labor Force | Age 35-44 Comparison
Immigrants from Korea
Paiute
84.6%
IN LABOR FORCE | AGE 35-44
88.2/ 100
METRIC RATING
134th/ 347
METRIC RANK
80.6%
IN LABOR FORCE | AGE 35-44
0.0/ 100
METRIC RATING
322nd/ 347
METRIC RANK
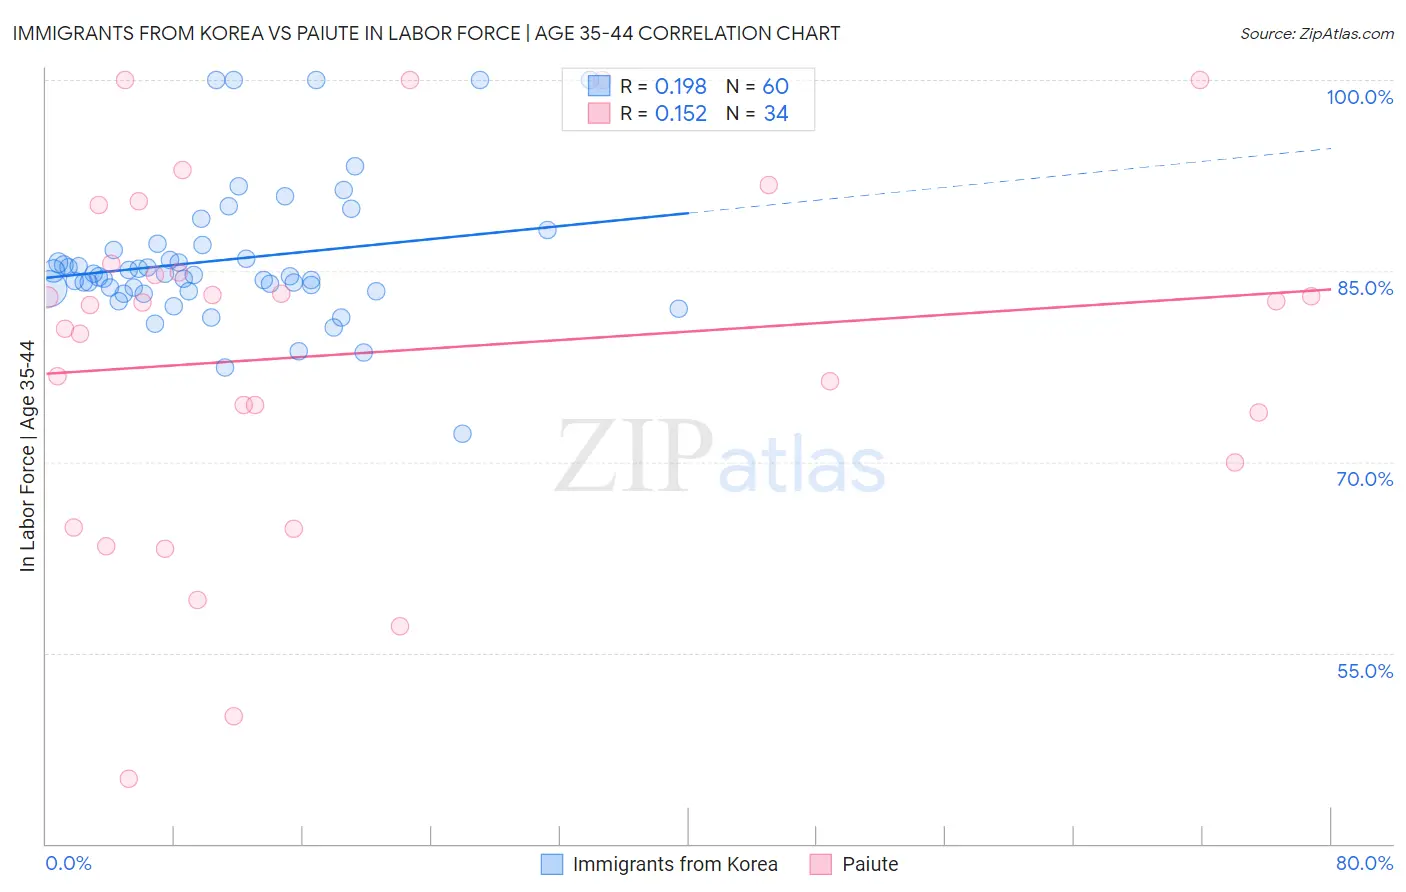
Immigrants from Korea vs Paiute In Labor Force | Age 35-44 Correlation Chart
The statistical analysis conducted on geographies consisting of 416,059,040 people shows a poor positive correlation between the proportion of Immigrants from Korea and labor force participation rate among population between the ages 35 and 44 in the United States with a correlation coefficient (R) of 0.198 and weighted average of 84.6%. Similarly, the statistical analysis conducted on geographies consisting of 58,391,639 people shows a poor positive correlation between the proportion of Paiute and labor force participation rate among population between the ages 35 and 44 in the United States with a correlation coefficient (R) of 0.152 and weighted average of 80.6%, a difference of 5.0%.
In Labor Force | Age 35-44 Correlation Summary
| Measurement | Immigrants from Korea | Paiute |
| Minimum | 72.2% | 45.1% |
| Maximum | 100.0% | 100.0% |
| Range | 27.8% | 54.9% |
| Mean | 85.9% | 78.7% |
| Median | 84.6% | 82.4% |
| Interquartile 25% (IQ1) | 83.5% | 70.0% |
| Interquartile 75% (IQ3) | 86.9% | 85.5% |
| Interquartile Range (IQR) | 3.3% | 15.5% |
| Standard Deviation (Sample) | 5.5% | 14.0% |
| Standard Deviation (Population) | 5.4% | 13.8% |
Similar Demographics by In Labor Force | Age 35-44
Demographics Similar to Immigrants from Korea by In Labor Force | Age 35-44
In terms of in labor force | age 35-44, the demographic groups most similar to Immigrants from Korea are Argentinean (84.6%, a difference of 0.0%), Immigrants from Malaysia (84.6%, a difference of 0.010%), Palestinian (84.7%, a difference of 0.020%), Bhutanese (84.7%, a difference of 0.020%), and Immigrants from Scotland (84.7%, a difference of 0.020%).
| Demographics | Rating | Rank | In Labor Force | Age 35-44 |
| Immigrants | Spain | 90.6 /100 | #127 | Exceptional 84.7% |
| Immigrants | Ghana | 90.4 /100 | #128 | Exceptional 84.7% |
| Palestinians | 89.7 /100 | #129 | Excellent 84.7% |
| Bhutanese | 89.7 /100 | #130 | Excellent 84.7% |
| Immigrants | Scotland | 89.6 /100 | #131 | Excellent 84.7% |
| Austrians | 89.4 /100 | #132 | Excellent 84.7% |
| Argentineans | 88.4 /100 | #133 | Excellent 84.6% |
| Immigrants | Korea | 88.2 /100 | #134 | Excellent 84.6% |
| Immigrants | Malaysia | 87.5 /100 | #135 | Excellent 84.6% |
| Afghans | 86.3 /100 | #136 | Excellent 84.6% |
| Immigrants | Chile | 84.6 /100 | #137 | Excellent 84.6% |
| Czechoslovakians | 82.6 /100 | #138 | Excellent 84.6% |
| Immigrants | Zaire | 82.5 /100 | #139 | Excellent 84.6% |
| Immigrants | Japan | 81.4 /100 | #140 | Excellent 84.6% |
| Immigrants | Belgium | 80.8 /100 | #141 | Excellent 84.6% |
Demographics Similar to Paiute by In Labor Force | Age 35-44
In terms of in labor force | age 35-44, the demographic groups most similar to Paiute are Puerto Rican (80.7%, a difference of 0.070%), Yaqui (80.5%, a difference of 0.11%), Choctaw (80.5%, a difference of 0.13%), Dutch West Indian (80.4%, a difference of 0.27%), and Seminole (80.4%, a difference of 0.31%).
| Demographics | Rating | Rank | In Labor Force | Age 35-44 |
| Immigrants | Mexico | 0.0 /100 | #315 | Tragic 81.5% |
| Comanche | 0.0 /100 | #316 | Tragic 81.5% |
| Cherokee | 0.0 /100 | #317 | Tragic 81.4% |
| Alaskan Athabascans | 0.0 /100 | #318 | Tragic 81.3% |
| Inupiat | 0.0 /100 | #319 | Tragic 80.9% |
| Chickasaw | 0.0 /100 | #320 | Tragic 80.9% |
| Puerto Ricans | 0.0 /100 | #321 | Tragic 80.7% |
| Paiute | 0.0 /100 | #322 | Tragic 80.6% |
| Yaqui | 0.0 /100 | #323 | Tragic 80.5% |
| Choctaw | 0.0 /100 | #324 | Tragic 80.5% |
| Dutch West Indians | 0.0 /100 | #325 | Tragic 80.4% |
| Seminole | 0.0 /100 | #326 | Tragic 80.4% |
| Sioux | 0.0 /100 | #327 | Tragic 80.2% |
| Creek | 0.0 /100 | #328 | Tragic 80.0% |
| Menominee | 0.0 /100 | #329 | Tragic 79.7% |