Ugandan vs Paiute In Labor Force | Age 35-44
COMPARE
Ugandan
Paiute
In Labor Force | Age 35-44
In Labor Force | Age 35-44 Comparison
Ugandans
Paiute
85.3%
IN LABOR FORCE | AGE 35-44
99.9/ 100
METRIC RATING
33rd/ 347
METRIC RANK
80.6%
IN LABOR FORCE | AGE 35-44
0.0/ 100
METRIC RATING
322nd/ 347
METRIC RANK
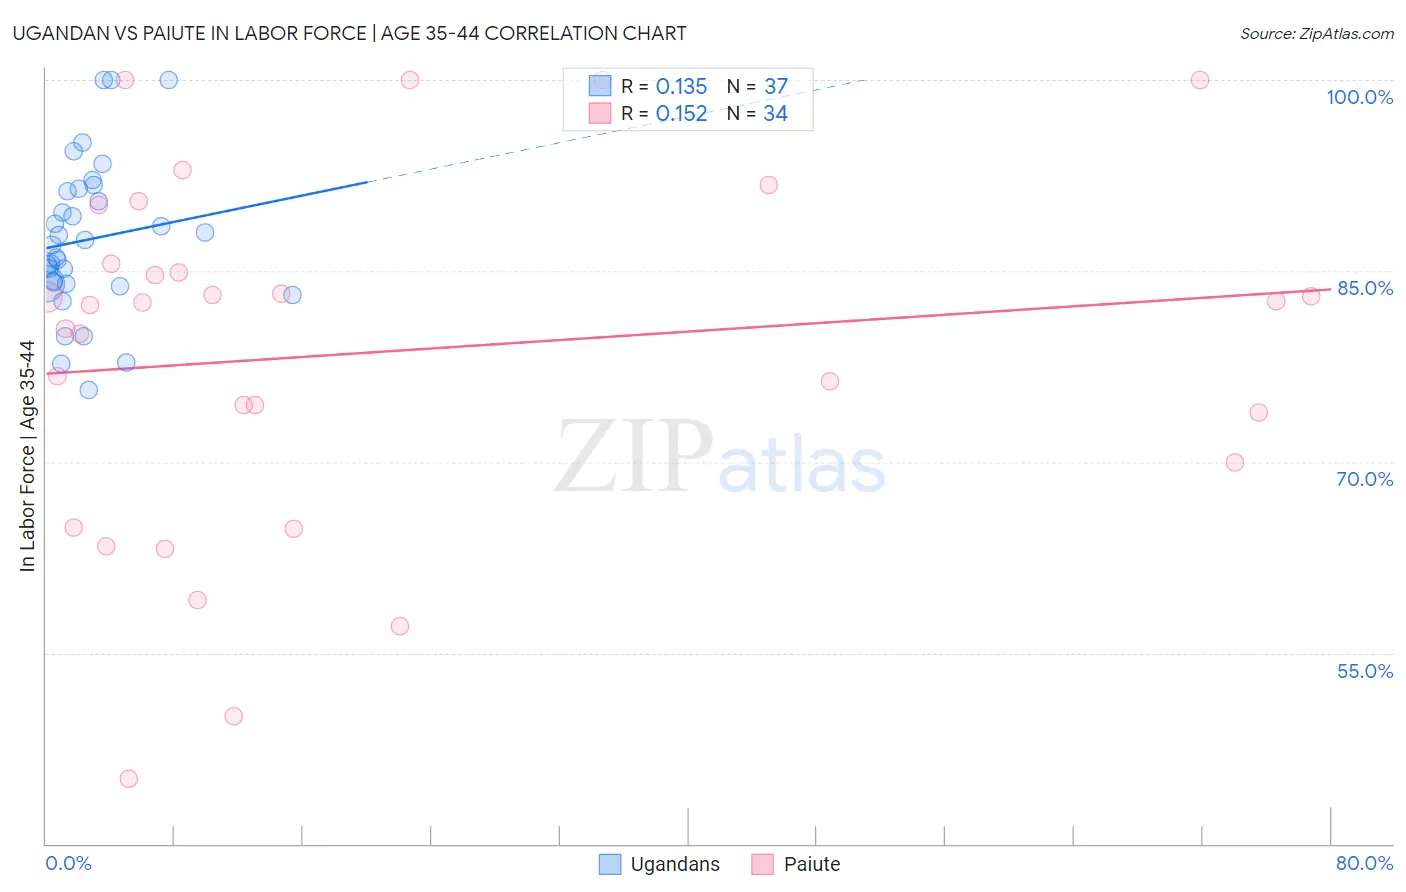
Ugandan vs Paiute In Labor Force | Age 35-44 Correlation Chart
The statistical analysis conducted on geographies consisting of 93,996,645 people shows a poor positive correlation between the proportion of Ugandans and labor force participation rate among population between the ages 35 and 44 in the United States with a correlation coefficient (R) of 0.135 and weighted average of 85.3%. Similarly, the statistical analysis conducted on geographies consisting of 58,391,639 people shows a poor positive correlation between the proportion of Paiute and labor force participation rate among population between the ages 35 and 44 in the United States with a correlation coefficient (R) of 0.152 and weighted average of 80.6%, a difference of 5.8%.
In Labor Force | Age 35-44 Correlation Summary
| Measurement | Ugandan | Paiute |
| Minimum | 75.6% | 45.1% |
| Maximum | 100.0% | 100.0% |
| Range | 24.4% | 54.9% |
| Mean | 87.5% | 78.7% |
| Median | 87.1% | 82.4% |
| Interquartile 25% (IQ1) | 84.0% | 70.0% |
| Interquartile 75% (IQ3) | 91.4% | 85.5% |
| Interquartile Range (IQR) | 7.4% | 15.5% |
| Standard Deviation (Sample) | 5.9% | 14.0% |
| Standard Deviation (Population) | 5.9% | 13.8% |
Similar Demographics by In Labor Force | Age 35-44
Demographics Similar to Ugandans by In Labor Force | Age 35-44
In terms of in labor force | age 35-44, the demographic groups most similar to Ugandans are Bermudan (85.3%, a difference of 0.010%), Czech (85.3%, a difference of 0.010%), Immigrants from India (85.3%, a difference of 0.010%), Immigrants from Nepal (85.3%, a difference of 0.020%), and Cambodian (85.3%, a difference of 0.030%).
| Demographics | Rating | Rank | In Labor Force | Age 35-44 |
| Immigrants | Liberia | 99.9 /100 | #26 | Exceptional 85.4% |
| Immigrants | Lithuania | 99.9 /100 | #27 | Exceptional 85.4% |
| Immigrants | Greece | 99.9 /100 | #28 | Exceptional 85.3% |
| Cambodians | 99.9 /100 | #29 | Exceptional 85.3% |
| Bermudans | 99.9 /100 | #30 | Exceptional 85.3% |
| Czechs | 99.9 /100 | #31 | Exceptional 85.3% |
| Immigrants | India | 99.9 /100 | #32 | Exceptional 85.3% |
| Ugandans | 99.9 /100 | #33 | Exceptional 85.3% |
| Immigrants | Nepal | 99.9 /100 | #34 | Exceptional 85.3% |
| Estonians | 99.9 /100 | #35 | Exceptional 85.3% |
| Immigrants | Morocco | 99.8 /100 | #36 | Exceptional 85.2% |
| Kenyans | 99.8 /100 | #37 | Exceptional 85.2% |
| Immigrants | Poland | 99.8 /100 | #38 | Exceptional 85.2% |
| Eastern Europeans | 99.8 /100 | #39 | Exceptional 85.2% |
| Immigrants | Bulgaria | 99.8 /100 | #40 | Exceptional 85.2% |
Demographics Similar to Paiute by In Labor Force | Age 35-44
In terms of in labor force | age 35-44, the demographic groups most similar to Paiute are Puerto Rican (80.7%, a difference of 0.070%), Yaqui (80.5%, a difference of 0.11%), Choctaw (80.5%, a difference of 0.13%), Dutch West Indian (80.4%, a difference of 0.27%), and Seminole (80.4%, a difference of 0.31%).
| Demographics | Rating | Rank | In Labor Force | Age 35-44 |
| Immigrants | Mexico | 0.0 /100 | #315 | Tragic 81.5% |
| Comanche | 0.0 /100 | #316 | Tragic 81.5% |
| Cherokee | 0.0 /100 | #317 | Tragic 81.4% |
| Alaskan Athabascans | 0.0 /100 | #318 | Tragic 81.3% |
| Inupiat | 0.0 /100 | #319 | Tragic 80.9% |
| Chickasaw | 0.0 /100 | #320 | Tragic 80.9% |
| Puerto Ricans | 0.0 /100 | #321 | Tragic 80.7% |
| Paiute | 0.0 /100 | #322 | Tragic 80.6% |
| Yaqui | 0.0 /100 | #323 | Tragic 80.5% |
| Choctaw | 0.0 /100 | #324 | Tragic 80.5% |
| Dutch West Indians | 0.0 /100 | #325 | Tragic 80.4% |
| Seminole | 0.0 /100 | #326 | Tragic 80.4% |
| Sioux | 0.0 /100 | #327 | Tragic 80.2% |
| Creek | 0.0 /100 | #328 | Tragic 80.0% |
| Menominee | 0.0 /100 | #329 | Tragic 79.7% |