Hmong vs Paiute In Labor Force | Age 35-44
COMPARE
Hmong
Paiute
In Labor Force | Age 35-44
In Labor Force | Age 35-44 Comparison
Hmong
Paiute
82.6%
IN LABOR FORCE | AGE 35-44
0.0/ 100
METRIC RATING
297th/ 347
METRIC RANK
80.6%
IN LABOR FORCE | AGE 35-44
0.0/ 100
METRIC RATING
322nd/ 347
METRIC RANK
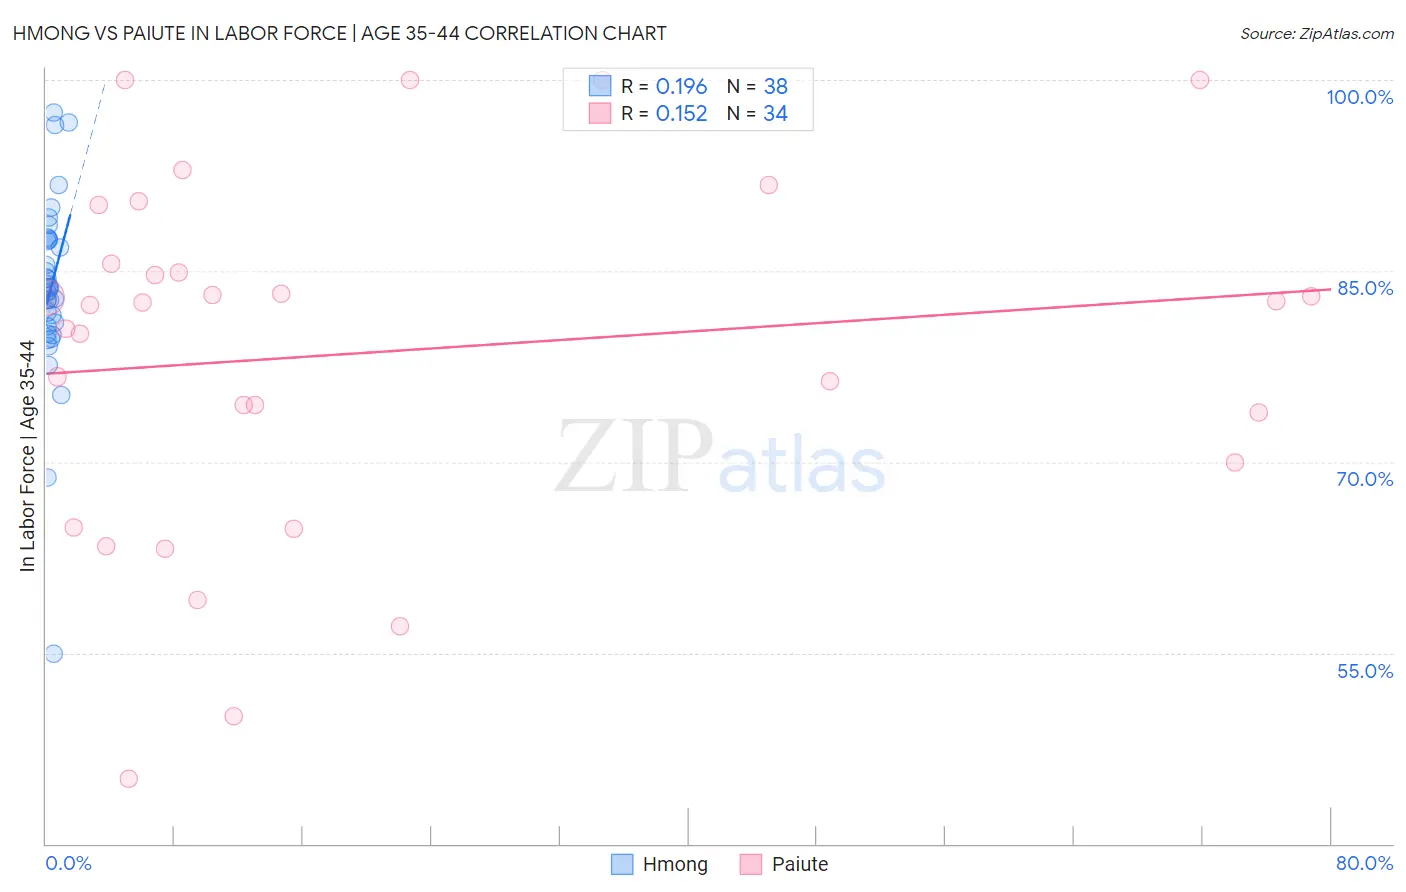
Hmong vs Paiute In Labor Force | Age 35-44 Correlation Chart
The statistical analysis conducted on geographies consisting of 24,669,739 people shows a poor positive correlation between the proportion of Hmong and labor force participation rate among population between the ages 35 and 44 in the United States with a correlation coefficient (R) of 0.196 and weighted average of 82.6%. Similarly, the statistical analysis conducted on geographies consisting of 58,391,639 people shows a poor positive correlation between the proportion of Paiute and labor force participation rate among population between the ages 35 and 44 in the United States with a correlation coefficient (R) of 0.152 and weighted average of 80.6%, a difference of 2.4%.
In Labor Force | Age 35-44 Correlation Summary
| Measurement | Hmong | Paiute |
| Minimum | 54.9% | 45.1% |
| Maximum | 97.4% | 100.0% |
| Range | 42.5% | 54.9% |
| Mean | 83.6% | 78.7% |
| Median | 83.7% | 82.4% |
| Interquartile 25% (IQ1) | 80.7% | 70.0% |
| Interquartile 75% (IQ3) | 87.4% | 85.5% |
| Interquartile Range (IQR) | 6.7% | 15.5% |
| Standard Deviation (Sample) | 7.4% | 14.0% |
| Standard Deviation (Population) | 7.3% | 13.8% |
Similar Demographics by In Labor Force | Age 35-44
Demographics Similar to Hmong by In Labor Force | Age 35-44
In terms of in labor force | age 35-44, the demographic groups most similar to Hmong are Mexican American Indian (82.6%, a difference of 0.010%), Ottawa (82.6%, a difference of 0.020%), Tlingit-Haida (82.5%, a difference of 0.030%), Central American Indian (82.5%, a difference of 0.090%), and Immigrants from Lebanon (82.7%, a difference of 0.10%).
| Demographics | Rating | Rank | In Labor Force | Age 35-44 |
| Africans | 0.0 /100 | #290 | Tragic 82.9% |
| Pennsylvania Germans | 0.0 /100 | #291 | Tragic 82.9% |
| Immigrants | Latin America | 0.0 /100 | #292 | Tragic 82.8% |
| Spanish Americans | 0.0 /100 | #293 | Tragic 82.8% |
| Potawatomi | 0.0 /100 | #294 | Tragic 82.7% |
| Immigrants | Lebanon | 0.0 /100 | #295 | Tragic 82.7% |
| Mexican American Indians | 0.0 /100 | #296 | Tragic 82.6% |
| Hmong | 0.0 /100 | #297 | Tragic 82.6% |
| Ottawa | 0.0 /100 | #298 | Tragic 82.6% |
| Tlingit-Haida | 0.0 /100 | #299 | Tragic 82.5% |
| Central American Indians | 0.0 /100 | #300 | Tragic 82.5% |
| Spanish American Indians | 0.0 /100 | #301 | Tragic 82.5% |
| Americans | 0.0 /100 | #302 | Tragic 82.4% |
| Nepalese | 0.0 /100 | #303 | Tragic 82.4% |
| Marshallese | 0.0 /100 | #304 | Tragic 82.4% |
Demographics Similar to Paiute by In Labor Force | Age 35-44
In terms of in labor force | age 35-44, the demographic groups most similar to Paiute are Puerto Rican (80.7%, a difference of 0.070%), Yaqui (80.5%, a difference of 0.11%), Choctaw (80.5%, a difference of 0.13%), Dutch West Indian (80.4%, a difference of 0.27%), and Seminole (80.4%, a difference of 0.31%).
| Demographics | Rating | Rank | In Labor Force | Age 35-44 |
| Immigrants | Mexico | 0.0 /100 | #315 | Tragic 81.5% |
| Comanche | 0.0 /100 | #316 | Tragic 81.5% |
| Cherokee | 0.0 /100 | #317 | Tragic 81.4% |
| Alaskan Athabascans | 0.0 /100 | #318 | Tragic 81.3% |
| Inupiat | 0.0 /100 | #319 | Tragic 80.9% |
| Chickasaw | 0.0 /100 | #320 | Tragic 80.9% |
| Puerto Ricans | 0.0 /100 | #321 | Tragic 80.7% |
| Paiute | 0.0 /100 | #322 | Tragic 80.6% |
| Yaqui | 0.0 /100 | #323 | Tragic 80.5% |
| Choctaw | 0.0 /100 | #324 | Tragic 80.5% |
| Dutch West Indians | 0.0 /100 | #325 | Tragic 80.4% |
| Seminole | 0.0 /100 | #326 | Tragic 80.4% |
| Sioux | 0.0 /100 | #327 | Tragic 80.2% |
| Creek | 0.0 /100 | #328 | Tragic 80.0% |
| Menominee | 0.0 /100 | #329 | Tragic 79.7% |