Immigrants from Korea vs Paiute 7th Grade
COMPARE
Immigrants from Korea
Paiute
7th Grade
7th Grade Comparison
Immigrants from Korea
Paiute
96.0%
7TH GRADE
49.2/ 100
METRIC RATING
177th/ 347
METRIC RANK
95.4%
7TH GRADE
1.2/ 100
METRIC RATING
248th/ 347
METRIC RANK
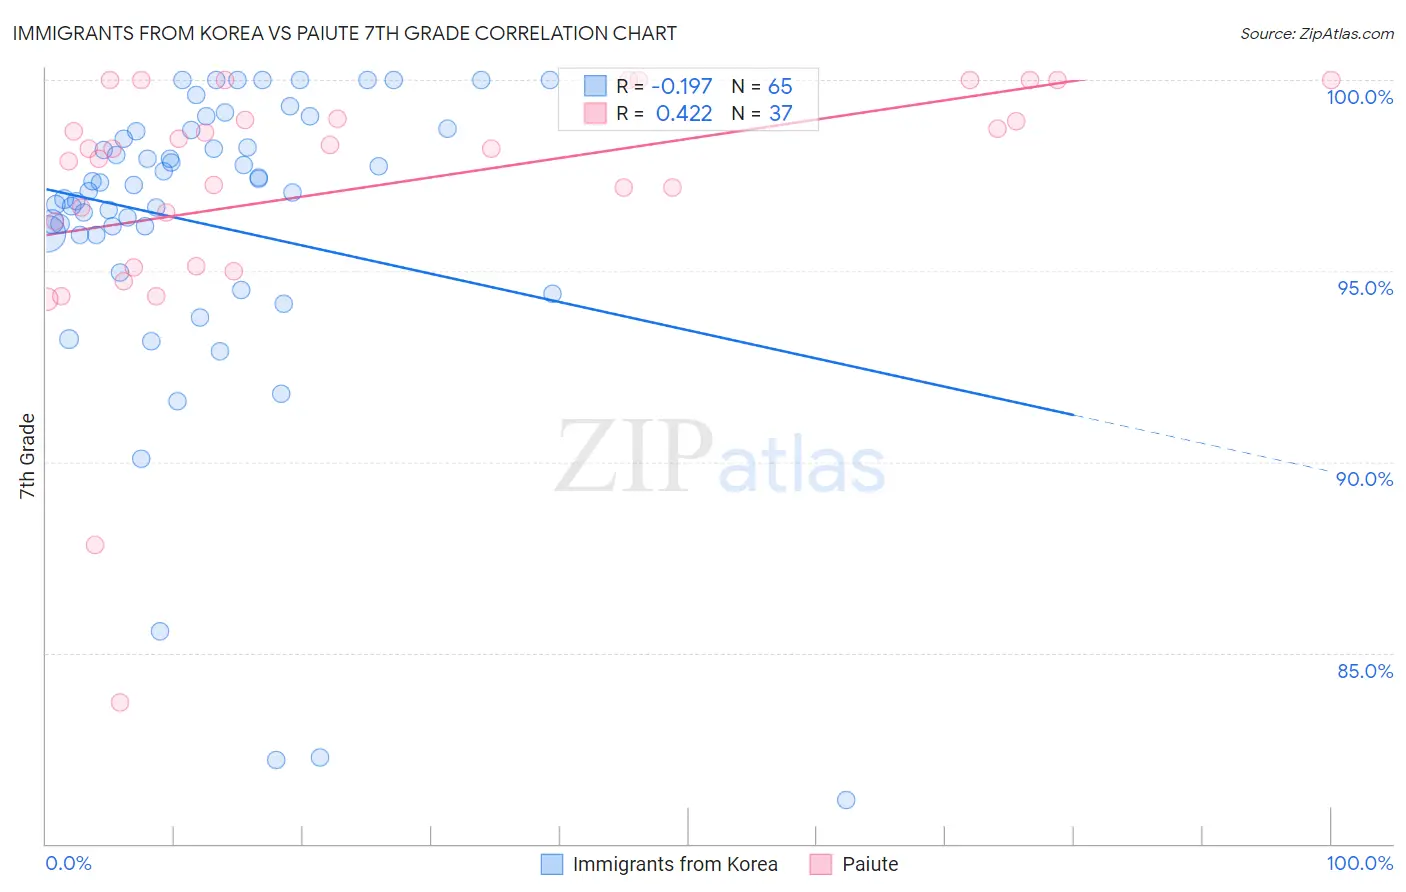
Immigrants from Korea vs Paiute 7th Grade Correlation Chart
The statistical analysis conducted on geographies consisting of 416,280,217 people shows a poor negative correlation between the proportion of Immigrants from Korea and percentage of population with at least 7th grade education in the United States with a correlation coefficient (R) of -0.197 and weighted average of 96.0%. Similarly, the statistical analysis conducted on geographies consisting of 58,403,520 people shows a moderate positive correlation between the proportion of Paiute and percentage of population with at least 7th grade education in the United States with a correlation coefficient (R) of 0.422 and weighted average of 95.4%, a difference of 0.68%.
7th Grade Correlation Summary
| Measurement | Immigrants from Korea | Paiute |
| Minimum | 81.1% | 83.7% |
| Maximum | 100.0% | 100.0% |
| Range | 18.9% | 16.3% |
| Mean | 96.2% | 97.2% |
| Median | 97.2% | 98.2% |
| Interquartile 25% (IQ1) | 95.9% | 95.7% |
| Interquartile 75% (IQ3) | 98.7% | 99.5% |
| Interquartile Range (IQR) | 2.7% | 3.8% |
| Standard Deviation (Sample) | 4.1% | 3.4% |
| Standard Deviation (Population) | 4.1% | 3.3% |
Similar Demographics by 7th Grade
Demographics Similar to Immigrants from Korea by 7th Grade
In terms of 7th grade, the demographic groups most similar to Immigrants from Korea are Black/African American (96.0%, a difference of 0.0%), Chilean (96.0%, a difference of 0.0%), Marshallese (96.0%, a difference of 0.0%), Venezuelan (96.0%, a difference of 0.010%), and Immigrants from Albania (96.0%, a difference of 0.010%).
| Demographics | Rating | Rank | 7th Grade |
| Immigrants | Ukraine | 55.0 /100 | #170 | Average 96.1% |
| Egyptians | 54.2 /100 | #171 | Average 96.1% |
| Venezuelans | 51.4 /100 | #172 | Average 96.0% |
| Immigrants | Albania | 50.4 /100 | #173 | Average 96.0% |
| Mongolians | 50.0 /100 | #174 | Average 96.0% |
| Blacks/African Americans | 49.5 /100 | #175 | Average 96.0% |
| Chileans | 49.3 /100 | #176 | Average 96.0% |
| Immigrants | Korea | 49.2 /100 | #177 | Average 96.0% |
| Marshallese | 48.4 /100 | #178 | Average 96.0% |
| Immigrants | Iran | 47.8 /100 | #179 | Average 96.0% |
| Immigrants | Brazil | 46.8 /100 | #180 | Average 96.0% |
| Pakistanis | 44.5 /100 | #181 | Average 96.0% |
| Iraqis | 41.2 /100 | #182 | Average 96.0% |
| Immigrants | Spain | 38.8 /100 | #183 | Fair 96.0% |
| Sierra Leoneans | 37.5 /100 | #184 | Fair 96.0% |
Demographics Similar to Paiute by 7th Grade
In terms of 7th grade, the demographic groups most similar to Paiute are Bolivian (95.4%, a difference of 0.010%), Tongan (95.4%, a difference of 0.020%), Immigrants from Cameroon (95.4%, a difference of 0.030%), Immigrants from Jamaica (95.4%, a difference of 0.030%), and Immigrants from Ethiopia (95.3%, a difference of 0.030%).
| Demographics | Rating | Rank | 7th Grade |
| South American Indians | 2.0 /100 | #241 | Tragic 95.5% |
| Immigrants | Senegal | 1.9 /100 | #242 | Tragic 95.5% |
| U.S. Virgin Islanders | 1.6 /100 | #243 | Tragic 95.4% |
| Uruguayans | 1.6 /100 | #244 | Tragic 95.4% |
| Immigrants | Middle Africa | 1.5 /100 | #245 | Tragic 95.4% |
| Ethiopians | 1.5 /100 | #246 | Tragic 95.4% |
| Tongans | 1.3 /100 | #247 | Tragic 95.4% |
| Paiute | 1.2 /100 | #248 | Tragic 95.4% |
| Bolivians | 1.1 /100 | #249 | Tragic 95.4% |
| Immigrants | Cameroon | 0.9 /100 | #250 | Tragic 95.4% |
| Immigrants | Jamaica | 0.9 /100 | #251 | Tragic 95.4% |
| Immigrants | Ethiopia | 0.9 /100 | #252 | Tragic 95.3% |
| Somalis | 0.9 /100 | #253 | Tragic 95.3% |
| Colombians | 0.8 /100 | #254 | Tragic 95.3% |
| Koreans | 0.8 /100 | #255 | Tragic 95.3% |