Vietnamese vs Paiute In Labor Force | Age 35-44
COMPARE
Vietnamese
Paiute
In Labor Force | Age 35-44
In Labor Force | Age 35-44 Comparison
Vietnamese
Paiute
83.5%
IN LABOR FORCE | AGE 35-44
0.2/ 100
METRIC RATING
260th/ 347
METRIC RANK
80.6%
IN LABOR FORCE | AGE 35-44
0.0/ 100
METRIC RATING
322nd/ 347
METRIC RANK
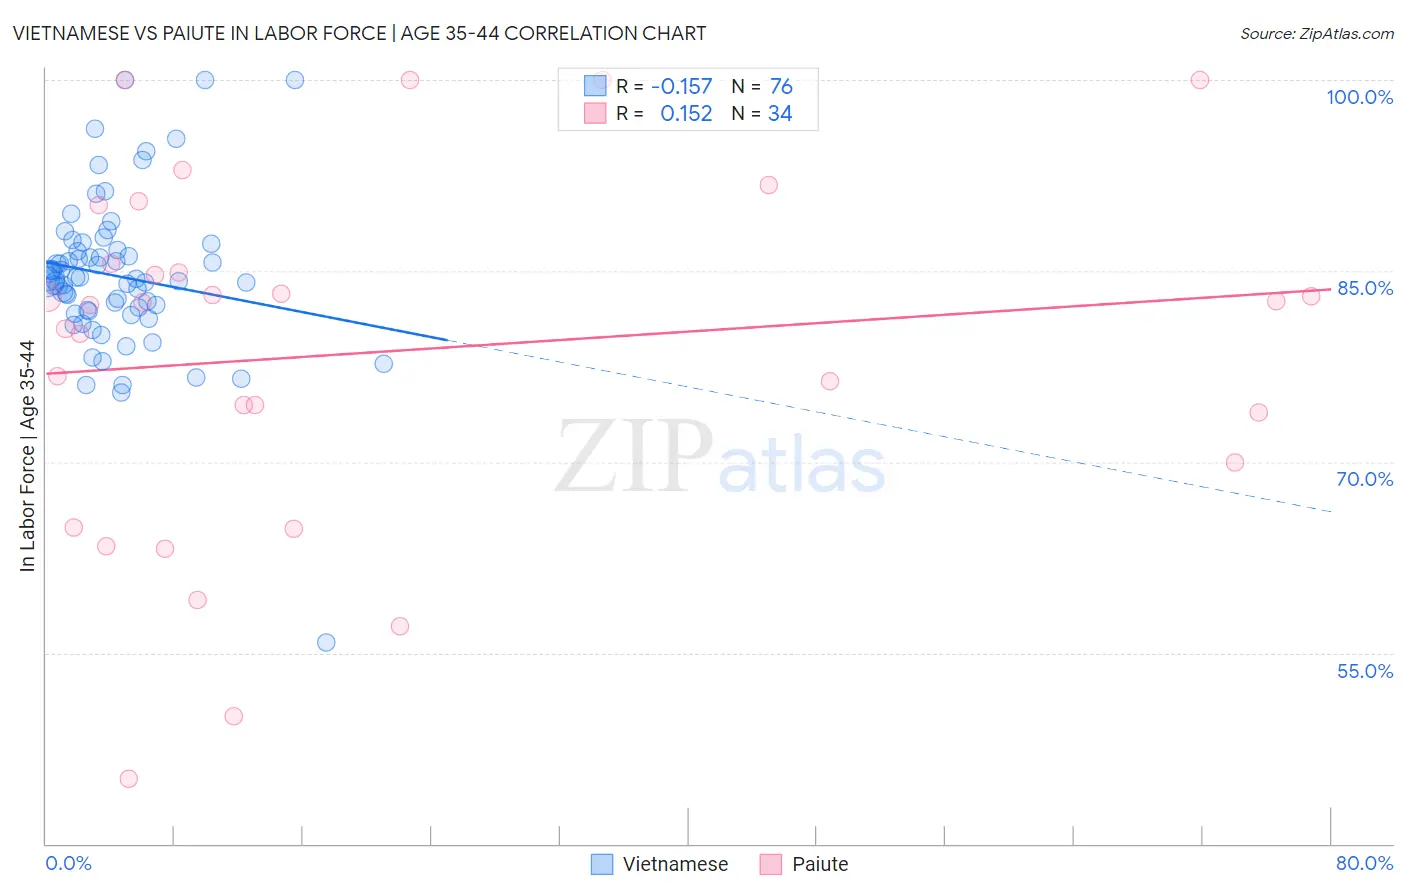
Vietnamese vs Paiute In Labor Force | Age 35-44 Correlation Chart
The statistical analysis conducted on geographies consisting of 170,595,548 people shows a poor negative correlation between the proportion of Vietnamese and labor force participation rate among population between the ages 35 and 44 in the United States with a correlation coefficient (R) of -0.157 and weighted average of 83.5%. Similarly, the statistical analysis conducted on geographies consisting of 58,391,639 people shows a poor positive correlation between the proportion of Paiute and labor force participation rate among population between the ages 35 and 44 in the United States with a correlation coefficient (R) of 0.152 and weighted average of 80.6%, a difference of 3.6%.
In Labor Force | Age 35-44 Correlation Summary
| Measurement | Vietnamese | Paiute |
| Minimum | 55.8% | 45.1% |
| Maximum | 100.0% | 100.0% |
| Range | 44.2% | 54.9% |
| Mean | 84.6% | 78.7% |
| Median | 84.4% | 82.4% |
| Interquartile 25% (IQ1) | 81.9% | 70.0% |
| Interquartile 75% (IQ3) | 86.6% | 85.5% |
| Interquartile Range (IQR) | 4.7% | 15.5% |
| Standard Deviation (Sample) | 6.3% | 14.0% |
| Standard Deviation (Population) | 6.2% | 13.8% |
Similar Demographics by In Labor Force | Age 35-44
Demographics Similar to Vietnamese by In Labor Force | Age 35-44
In terms of in labor force | age 35-44, the demographic groups most similar to Vietnamese are Immigrants from Dominica (83.5%, a difference of 0.0%), Immigrants from El Salvador (83.5%, a difference of 0.010%), Immigrants from Congo (83.5%, a difference of 0.010%), Tsimshian (83.5%, a difference of 0.030%), and Iroquois (83.5%, a difference of 0.040%).
| Demographics | Rating | Rank | In Labor Force | Age 35-44 |
| Lebanese | 0.4 /100 | #253 | Tragic 83.6% |
| Tongans | 0.4 /100 | #254 | Tragic 83.6% |
| Immigrants | Azores | 0.3 /100 | #255 | Tragic 83.6% |
| Japanese | 0.3 /100 | #256 | Tragic 83.6% |
| Basques | 0.3 /100 | #257 | Tragic 83.6% |
| Tsimshian | 0.2 /100 | #258 | Tragic 83.5% |
| Immigrants | El Salvador | 0.2 /100 | #259 | Tragic 83.5% |
| Vietnamese | 0.2 /100 | #260 | Tragic 83.5% |
| Immigrants | Dominica | 0.2 /100 | #261 | Tragic 83.5% |
| Immigrants | Congo | 0.2 /100 | #262 | Tragic 83.5% |
| Iroquois | 0.2 /100 | #263 | Tragic 83.5% |
| Scotch-Irish | 0.1 /100 | #264 | Tragic 83.5% |
| Central Americans | 0.1 /100 | #265 | Tragic 83.5% |
| Spaniards | 0.1 /100 | #266 | Tragic 83.4% |
| Guamanians/Chamorros | 0.1 /100 | #267 | Tragic 83.4% |
Demographics Similar to Paiute by In Labor Force | Age 35-44
In terms of in labor force | age 35-44, the demographic groups most similar to Paiute are Puerto Rican (80.7%, a difference of 0.070%), Yaqui (80.5%, a difference of 0.11%), Choctaw (80.5%, a difference of 0.13%), Dutch West Indian (80.4%, a difference of 0.27%), and Seminole (80.4%, a difference of 0.31%).
| Demographics | Rating | Rank | In Labor Force | Age 35-44 |
| Immigrants | Mexico | 0.0 /100 | #315 | Tragic 81.5% |
| Comanche | 0.0 /100 | #316 | Tragic 81.5% |
| Cherokee | 0.0 /100 | #317 | Tragic 81.4% |
| Alaskan Athabascans | 0.0 /100 | #318 | Tragic 81.3% |
| Inupiat | 0.0 /100 | #319 | Tragic 80.9% |
| Chickasaw | 0.0 /100 | #320 | Tragic 80.9% |
| Puerto Ricans | 0.0 /100 | #321 | Tragic 80.7% |
| Paiute | 0.0 /100 | #322 | Tragic 80.6% |
| Yaqui | 0.0 /100 | #323 | Tragic 80.5% |
| Choctaw | 0.0 /100 | #324 | Tragic 80.5% |
| Dutch West Indians | 0.0 /100 | #325 | Tragic 80.4% |
| Seminole | 0.0 /100 | #326 | Tragic 80.4% |
| Sioux | 0.0 /100 | #327 | Tragic 80.2% |
| Creek | 0.0 /100 | #328 | Tragic 80.0% |
| Menominee | 0.0 /100 | #329 | Tragic 79.7% |