Immigrants from Kenya vs Immigrants from Costa Rica In Labor Force | Age 20-64
COMPARE
Immigrants from Kenya
Immigrants from Costa Rica
In Labor Force | Age 20-64
In Labor Force | Age 20-64 Comparison
Immigrants from Kenya
Immigrants from Costa Rica
80.7%
IN LABOR FORCE | AGE 20-64
99.9/ 100
METRIC RATING
27th/ 347
METRIC RANK
79.7%
IN LABOR FORCE | AGE 20-64
64.6/ 100
METRIC RATING
163rd/ 347
METRIC RANK
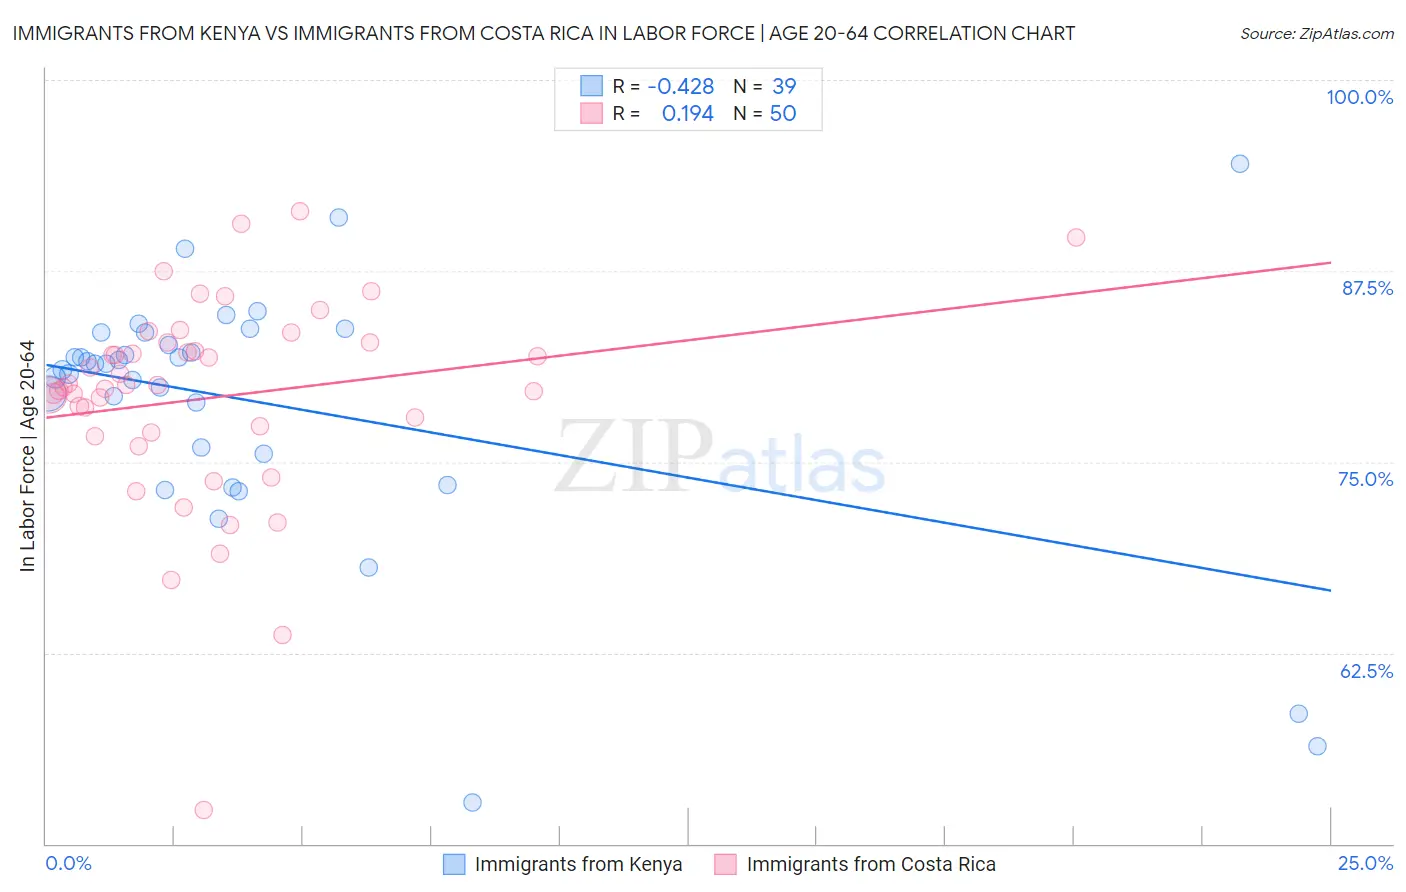
Immigrants from Kenya vs Immigrants from Costa Rica In Labor Force | Age 20-64 Correlation Chart
The statistical analysis conducted on geographies consisting of 218,088,200 people shows a moderate negative correlation between the proportion of Immigrants from Kenya and labor force participation rate among population between the ages 20 and 64 in the United States with a correlation coefficient (R) of -0.428 and weighted average of 80.7%. Similarly, the statistical analysis conducted on geographies consisting of 204,275,671 people shows a poor positive correlation between the proportion of Immigrants from Costa Rica and labor force participation rate among population between the ages 20 and 64 in the United States with a correlation coefficient (R) of 0.194 and weighted average of 79.7%, a difference of 1.4%.
In Labor Force | Age 20-64 Correlation Summary
| Measurement | Immigrants from Kenya | Immigrants from Costa Rica |
| Minimum | 52.7% | 52.2% |
| Maximum | 94.5% | 91.4% |
| Range | 41.8% | 39.2% |
| Mean | 78.8% | 79.2% |
| Median | 81.4% | 80.0% |
| Interquartile 25% (IQ1) | 75.6% | 76.9% |
| Interquartile 75% (IQ3) | 83.4% | 82.8% |
| Interquartile Range (IQR) | 7.9% | 5.9% |
| Standard Deviation (Sample) | 8.4% | 6.9% |
| Standard Deviation (Population) | 8.3% | 6.8% |
Similar Demographics by In Labor Force | Age 20-64
Demographics Similar to Immigrants from Kenya by In Labor Force | Age 20-64
In terms of in labor force | age 20-64, the demographic groups most similar to Immigrants from Kenya are Immigrants from Uganda (80.7%, a difference of 0.010%), Immigrants from South Central Asia (80.7%, a difference of 0.030%), Immigrants from North Macedonia (80.7%, a difference of 0.030%), Immigrants from Lithuania (80.7%, a difference of 0.050%), and Immigrants from Ireland (80.7%, a difference of 0.060%).
| Demographics | Rating | Rank | In Labor Force | Age 20-64 |
| Thais | 100.0 /100 | #20 | Exceptional 80.9% |
| Liberians | 100.0 /100 | #21 | Exceptional 80.9% |
| Sudanese | 100.0 /100 | #22 | Exceptional 80.8% |
| Immigrants | Bosnia and Herzegovina | 100.0 /100 | #23 | Exceptional 80.8% |
| Immigrants | Morocco | 100.0 /100 | #24 | Exceptional 80.8% |
| Kenyans | 100.0 /100 | #25 | Exceptional 80.8% |
| Immigrants | Serbia | 100.0 /100 | #26 | Exceptional 80.8% |
| Immigrants | Kenya | 99.9 /100 | #27 | Exceptional 80.7% |
| Immigrants | Uganda | 99.9 /100 | #28 | Exceptional 80.7% |
| Immigrants | South Central Asia | 99.9 /100 | #29 | Exceptional 80.7% |
| Immigrants | North Macedonia | 99.9 /100 | #30 | Exceptional 80.7% |
| Immigrants | Lithuania | 99.9 /100 | #31 | Exceptional 80.7% |
| Immigrants | Ireland | 99.9 /100 | #32 | Exceptional 80.7% |
| Chinese | 99.9 /100 | #33 | Exceptional 80.7% |
| Immigrants | Brazil | 99.9 /100 | #34 | Exceptional 80.7% |
Demographics Similar to Immigrants from Costa Rica by In Labor Force | Age 20-64
In terms of in labor force | age 20-64, the demographic groups most similar to Immigrants from Costa Rica are Immigrants from Burma/Myanmar (79.7%, a difference of 0.0%), Nigerian (79.7%, a difference of 0.0%), South African (79.7%, a difference of 0.010%), German (79.7%, a difference of 0.010%), and Immigrants from Cuba (79.7%, a difference of 0.020%).
| Demographics | Rating | Rank | In Labor Force | Age 20-64 |
| Senegalese | 69.1 /100 | #156 | Good 79.7% |
| Immigrants | China | 69.1 /100 | #157 | Good 79.7% |
| Austrians | 67.6 /100 | #158 | Good 79.7% |
| Immigrants | Cuba | 66.7 /100 | #159 | Good 79.7% |
| Moroccans | 66.7 /100 | #160 | Good 79.7% |
| South Africans | 66.2 /100 | #161 | Good 79.7% |
| Germans | 65.2 /100 | #162 | Good 79.7% |
| Immigrants | Costa Rica | 64.6 /100 | #163 | Good 79.7% |
| Immigrants | Burma/Myanmar | 64.4 /100 | #164 | Good 79.7% |
| Nigerians | 64.0 /100 | #165 | Good 79.7% |
| Okinawans | 62.7 /100 | #166 | Good 79.6% |
| Immigrants | Iraq | 62.0 /100 | #167 | Good 79.6% |
| Immigrants | Indonesia | 61.8 /100 | #168 | Good 79.6% |
| Laotians | 58.4 /100 | #169 | Average 79.6% |
| Slavs | 54.0 /100 | #170 | Average 79.6% |