Immigrants from Kenya vs Immigrants from France In Labor Force | Age 20-64
COMPARE
Immigrants from Kenya
Immigrants from France
In Labor Force | Age 20-64
In Labor Force | Age 20-64 Comparison
Immigrants from Kenya
Immigrants from France
80.7%
IN LABOR FORCE | AGE 20-64
99.9/ 100
METRIC RATING
27th/ 347
METRIC RANK
79.9%
IN LABOR FORCE | AGE 20-64
90.7/ 100
METRIC RATING
126th/ 347
METRIC RANK
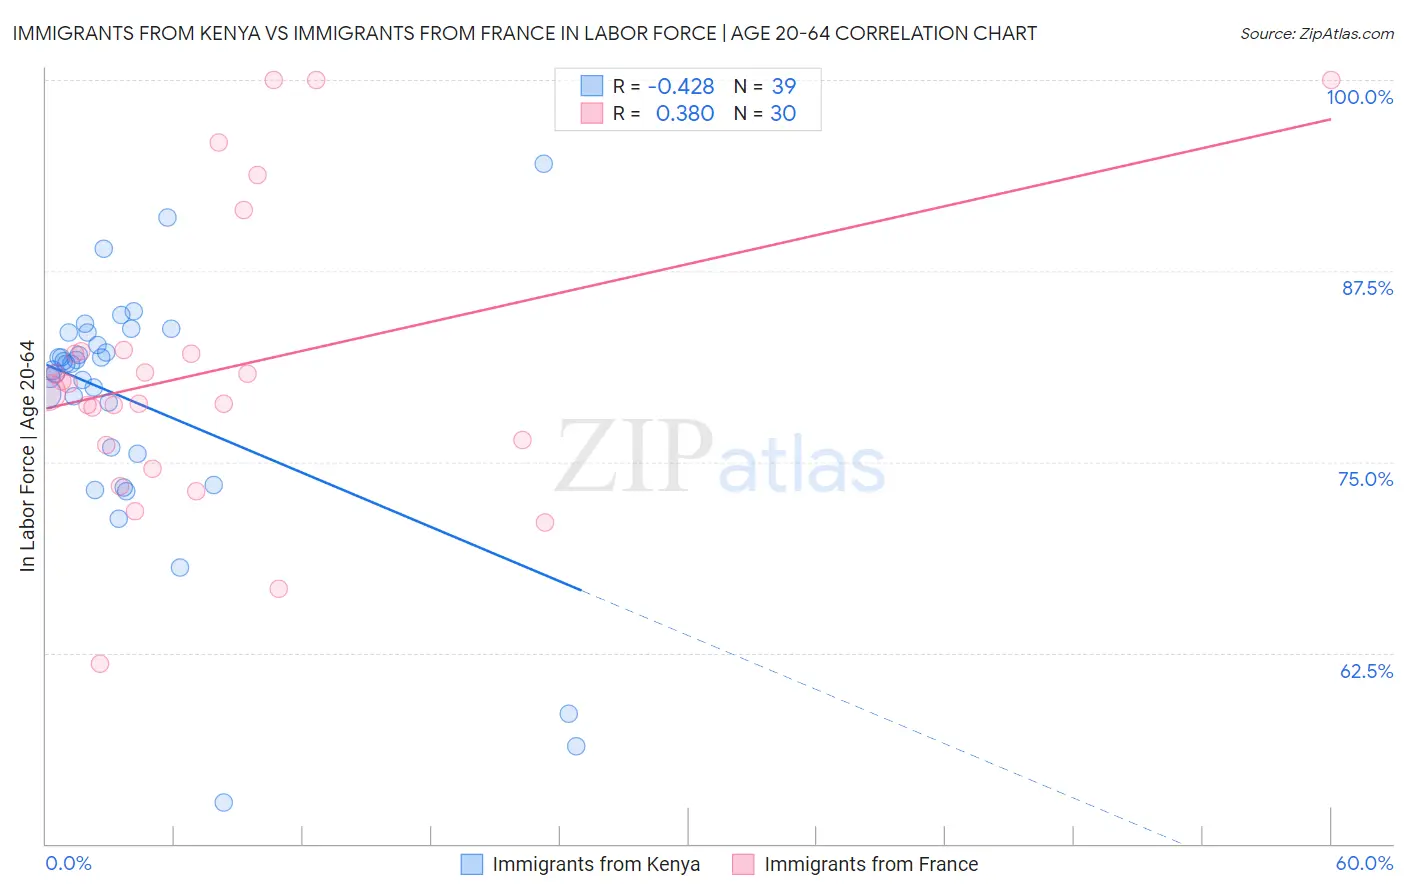
Immigrants from Kenya vs Immigrants from France In Labor Force | Age 20-64 Correlation Chart
The statistical analysis conducted on geographies consisting of 218,088,200 people shows a moderate negative correlation between the proportion of Immigrants from Kenya and labor force participation rate among population between the ages 20 and 64 in the United States with a correlation coefficient (R) of -0.428 and weighted average of 80.7%. Similarly, the statistical analysis conducted on geographies consisting of 287,921,180 people shows a mild positive correlation between the proportion of Immigrants from France and labor force participation rate among population between the ages 20 and 64 in the United States with a correlation coefficient (R) of 0.380 and weighted average of 79.9%, a difference of 1.0%.
In Labor Force | Age 20-64 Correlation Summary
| Measurement | Immigrants from Kenya | Immigrants from France |
| Minimum | 52.7% | 61.8% |
| Maximum | 94.5% | 100.0% |
| Range | 41.8% | 38.2% |
| Mean | 78.8% | 81.0% |
| Median | 81.4% | 79.8% |
| Interquartile 25% (IQ1) | 75.6% | 76.1% |
| Interquartile 75% (IQ3) | 83.4% | 82.3% |
| Interquartile Range (IQR) | 7.9% | 6.2% |
| Standard Deviation (Sample) | 8.4% | 9.4% |
| Standard Deviation (Population) | 8.3% | 9.3% |
Similar Demographics by In Labor Force | Age 20-64
Demographics Similar to Immigrants from Kenya by In Labor Force | Age 20-64
In terms of in labor force | age 20-64, the demographic groups most similar to Immigrants from Kenya are Immigrants from Uganda (80.7%, a difference of 0.010%), Immigrants from South Central Asia (80.7%, a difference of 0.030%), Immigrants from North Macedonia (80.7%, a difference of 0.030%), Immigrants from Lithuania (80.7%, a difference of 0.050%), and Immigrants from Ireland (80.7%, a difference of 0.060%).
| Demographics | Rating | Rank | In Labor Force | Age 20-64 |
| Thais | 100.0 /100 | #20 | Exceptional 80.9% |
| Liberians | 100.0 /100 | #21 | Exceptional 80.9% |
| Sudanese | 100.0 /100 | #22 | Exceptional 80.8% |
| Immigrants | Bosnia and Herzegovina | 100.0 /100 | #23 | Exceptional 80.8% |
| Immigrants | Morocco | 100.0 /100 | #24 | Exceptional 80.8% |
| Kenyans | 100.0 /100 | #25 | Exceptional 80.8% |
| Immigrants | Serbia | 100.0 /100 | #26 | Exceptional 80.8% |
| Immigrants | Kenya | 99.9 /100 | #27 | Exceptional 80.7% |
| Immigrants | Uganda | 99.9 /100 | #28 | Exceptional 80.7% |
| Immigrants | South Central Asia | 99.9 /100 | #29 | Exceptional 80.7% |
| Immigrants | North Macedonia | 99.9 /100 | #30 | Exceptional 80.7% |
| Immigrants | Lithuania | 99.9 /100 | #31 | Exceptional 80.7% |
| Immigrants | Ireland | 99.9 /100 | #32 | Exceptional 80.7% |
| Chinese | 99.9 /100 | #33 | Exceptional 80.7% |
| Immigrants | Brazil | 99.9 /100 | #34 | Exceptional 80.7% |
Demographics Similar to Immigrants from France by In Labor Force | Age 20-64
In terms of in labor force | age 20-64, the demographic groups most similar to Immigrants from France are Immigrants from Europe (79.9%, a difference of 0.020%), Danish (79.9%, a difference of 0.020%), Immigrants from Czechoslovakia (79.9%, a difference of 0.020%), Mongolian (79.9%, a difference of 0.030%), and Immigrants from Russia (79.9%, a difference of 0.030%).
| Demographics | Rating | Rank | In Labor Force | Age 20-64 |
| Immigrants | Taiwan | 92.5 /100 | #119 | Exceptional 80.0% |
| Maltese | 92.4 /100 | #120 | Exceptional 80.0% |
| Immigrants | Kuwait | 92.2 /100 | #121 | Exceptional 80.0% |
| Mongolians | 92.0 /100 | #122 | Exceptional 79.9% |
| Immigrants | Russia | 91.8 /100 | #123 | Exceptional 79.9% |
| Immigrants | Europe | 91.6 /100 | #124 | Exceptional 79.9% |
| Danes | 91.5 /100 | #125 | Exceptional 79.9% |
| Immigrants | France | 90.7 /100 | #126 | Exceptional 79.9% |
| Immigrants | Czechoslovakia | 89.7 /100 | #127 | Excellent 79.9% |
| Immigrants | Eastern Asia | 89.4 /100 | #128 | Excellent 79.9% |
| Italians | 88.9 /100 | #129 | Excellent 79.9% |
| Immigrants | Zaire | 88.6 /100 | #130 | Excellent 79.9% |
| Immigrants | Iran | 88.3 /100 | #131 | Excellent 79.9% |
| Indians (Asian) | 87.7 /100 | #132 | Excellent 79.9% |
| South American Indians | 87.6 /100 | #133 | Excellent 79.9% |