Immigrants from Kenya vs Slovene In Labor Force | Age 20-64
COMPARE
Immigrants from Kenya
Slovene
In Labor Force | Age 20-64
In Labor Force | Age 20-64 Comparison
Immigrants from Kenya
Slovenes
80.7%
IN LABOR FORCE | AGE 20-64
99.9/ 100
METRIC RATING
27th/ 347
METRIC RANK
80.5%
IN LABOR FORCE | AGE 20-64
99.7/ 100
METRIC RATING
45th/ 347
METRIC RANK
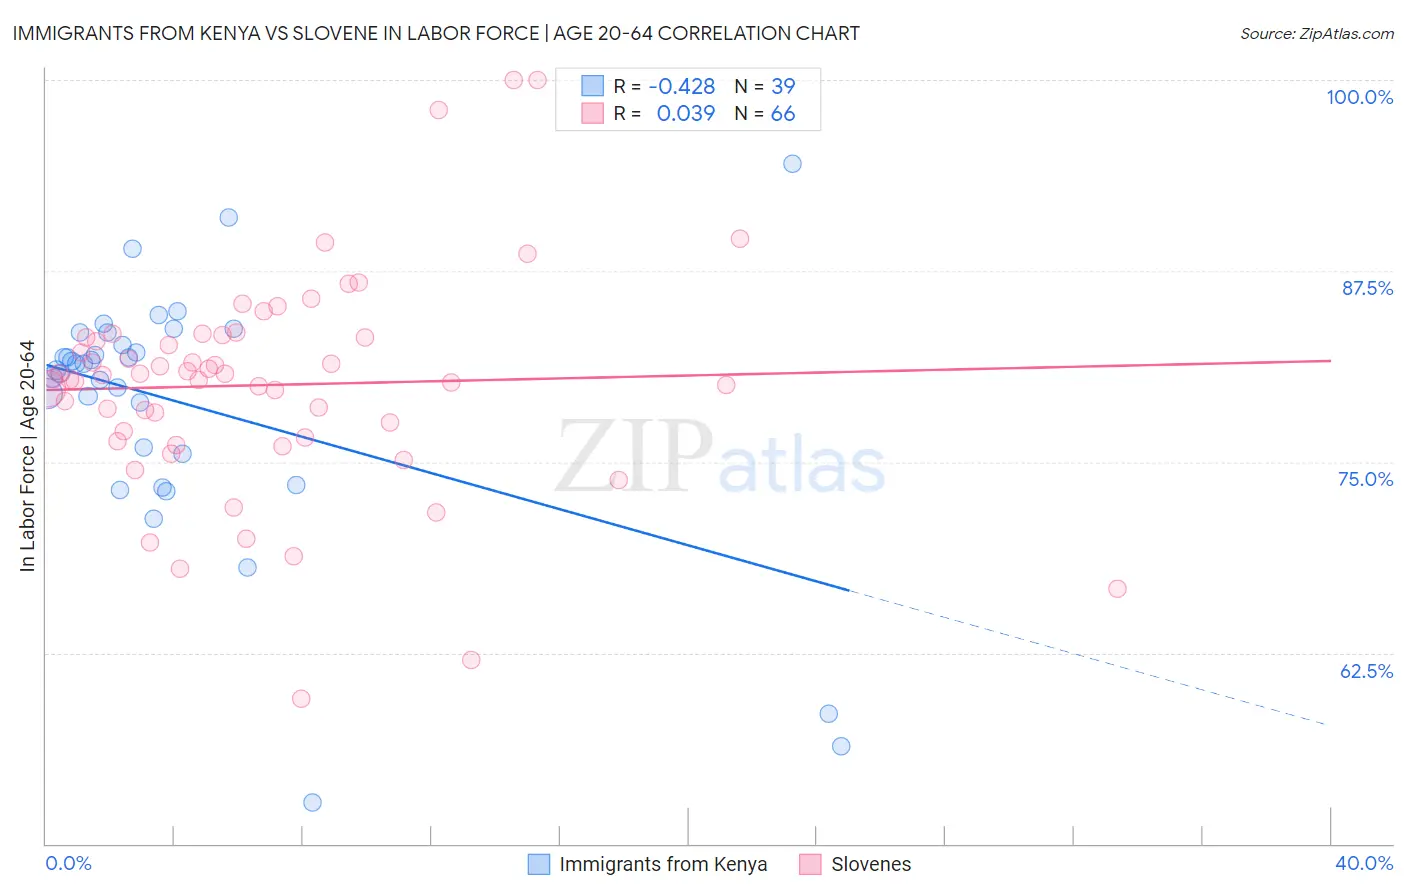
Immigrants from Kenya vs Slovene In Labor Force | Age 20-64 Correlation Chart
The statistical analysis conducted on geographies consisting of 218,088,200 people shows a moderate negative correlation between the proportion of Immigrants from Kenya and labor force participation rate among population between the ages 20 and 64 in the United States with a correlation coefficient (R) of -0.428 and weighted average of 80.7%. Similarly, the statistical analysis conducted on geographies consisting of 261,356,284 people shows no correlation between the proportion of Slovenes and labor force participation rate among population between the ages 20 and 64 in the United States with a correlation coefficient (R) of 0.039 and weighted average of 80.5%, a difference of 0.35%.
In Labor Force | Age 20-64 Correlation Summary
| Measurement | Immigrants from Kenya | Slovene |
| Minimum | 52.7% | 59.5% |
| Maximum | 94.5% | 100.0% |
| Range | 41.8% | 40.5% |
| Mean | 78.8% | 80.0% |
| Median | 81.4% | 80.6% |
| Interquartile 25% (IQ1) | 75.6% | 76.6% |
| Interquartile 75% (IQ3) | 83.4% | 83.1% |
| Interquartile Range (IQR) | 7.9% | 6.5% |
| Standard Deviation (Sample) | 8.4% | 7.2% |
| Standard Deviation (Population) | 8.3% | 7.2% |
Demographics Similar to Immigrants from Kenya and Slovenes by In Labor Force | Age 20-64
In terms of in labor force | age 20-64, the demographic groups most similar to Immigrants from Kenya are Immigrants from Uganda (80.7%, a difference of 0.010%), Immigrants from South Central Asia (80.7%, a difference of 0.030%), Immigrants from North Macedonia (80.7%, a difference of 0.030%), Immigrants from Lithuania (80.7%, a difference of 0.050%), and Immigrants from Ireland (80.7%, a difference of 0.060%). Similarly, the demographic groups most similar to Slovenes are Immigrants from Pakistan (80.5%, a difference of 0.010%), Immigrants from Middle Africa (80.5%, a difference of 0.020%), Czech (80.5%, a difference of 0.060%), Latvian (80.5%, a difference of 0.070%), and Immigrants from Liberia (80.5%, a difference of 0.080%).
| Demographics | Rating | Rank | In Labor Force | Age 20-64 |
| Immigrants | Serbia | 100.0 /100 | #26 | Exceptional 80.8% |
| Immigrants | Kenya | 99.9 /100 | #27 | Exceptional 80.7% |
| Immigrants | Uganda | 99.9 /100 | #28 | Exceptional 80.7% |
| Immigrants | South Central Asia | 99.9 /100 | #29 | Exceptional 80.7% |
| Immigrants | North Macedonia | 99.9 /100 | #30 | Exceptional 80.7% |
| Immigrants | Lithuania | 99.9 /100 | #31 | Exceptional 80.7% |
| Immigrants | Ireland | 99.9 /100 | #32 | Exceptional 80.7% |
| Chinese | 99.9 /100 | #33 | Exceptional 80.7% |
| Immigrants | Brazil | 99.9 /100 | #34 | Exceptional 80.7% |
| Immigrants | Poland | 99.9 /100 | #35 | Exceptional 80.6% |
| Paraguayans | 99.8 /100 | #36 | Exceptional 80.6% |
| Immigrants | Moldova | 99.8 /100 | #37 | Exceptional 80.6% |
| Ugandans | 99.8 /100 | #38 | Exceptional 80.6% |
| Brazilians | 99.8 /100 | #39 | Exceptional 80.5% |
| Immigrants | Zimbabwe | 99.8 /100 | #40 | Exceptional 80.5% |
| Immigrants | Liberia | 99.8 /100 | #41 | Exceptional 80.5% |
| Latvians | 99.8 /100 | #42 | Exceptional 80.5% |
| Czechs | 99.7 /100 | #43 | Exceptional 80.5% |
| Immigrants | Middle Africa | 99.7 /100 | #44 | Exceptional 80.5% |
| Slovenes | 99.7 /100 | #45 | Exceptional 80.5% |
| Immigrants | Pakistan | 99.6 /100 | #46 | Exceptional 80.5% |