Immigrants from Kenya vs British West Indian In Labor Force | Age 20-64
COMPARE
Immigrants from Kenya
British West Indian
In Labor Force | Age 20-64
In Labor Force | Age 20-64 Comparison
Immigrants from Kenya
British West Indians
80.7%
IN LABOR FORCE | AGE 20-64
99.9/ 100
METRIC RATING
27th/ 347
METRIC RANK
78.4%
IN LABOR FORCE | AGE 20-64
0.1/ 100
METRIC RATING
265th/ 347
METRIC RANK
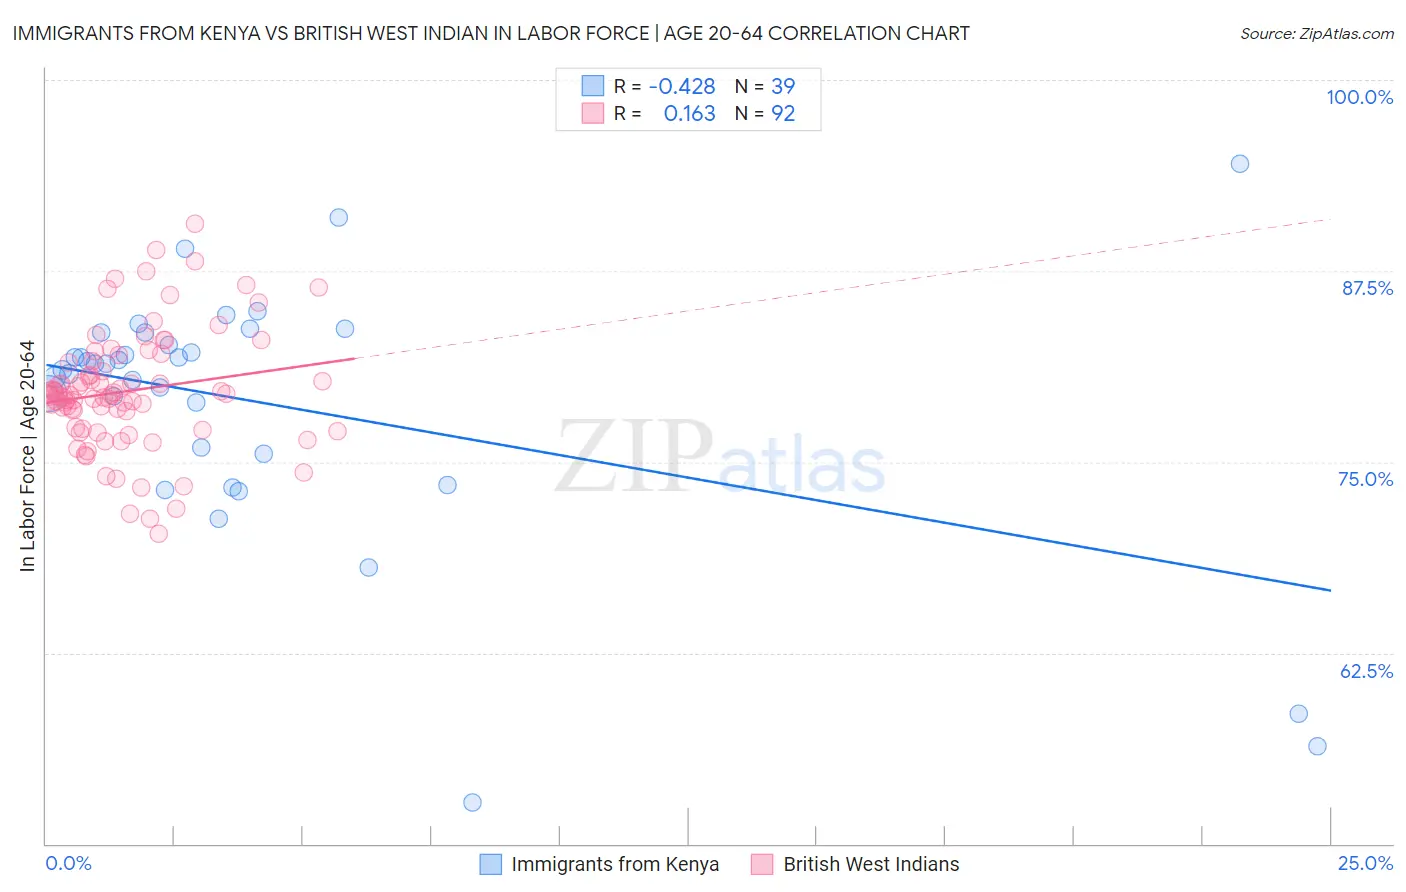
Immigrants from Kenya vs British West Indian In Labor Force | Age 20-64 Correlation Chart
The statistical analysis conducted on geographies consisting of 218,088,200 people shows a moderate negative correlation between the proportion of Immigrants from Kenya and labor force participation rate among population between the ages 20 and 64 in the United States with a correlation coefficient (R) of -0.428 and weighted average of 80.7%. Similarly, the statistical analysis conducted on geographies consisting of 152,617,449 people shows a poor positive correlation between the proportion of British West Indians and labor force participation rate among population between the ages 20 and 64 in the United States with a correlation coefficient (R) of 0.163 and weighted average of 78.4%, a difference of 3.0%.
In Labor Force | Age 20-64 Correlation Summary
| Measurement | Immigrants from Kenya | British West Indian |
| Minimum | 52.7% | 70.3% |
| Maximum | 94.5% | 90.6% |
| Range | 41.8% | 20.3% |
| Mean | 78.8% | 79.6% |
| Median | 81.4% | 79.4% |
| Interquartile 25% (IQ1) | 75.6% | 77.2% |
| Interquartile 75% (IQ3) | 83.4% | 81.5% |
| Interquartile Range (IQR) | 7.9% | 4.3% |
| Standard Deviation (Sample) | 8.4% | 3.9% |
| Standard Deviation (Population) | 8.3% | 3.9% |
Similar Demographics by In Labor Force | Age 20-64
Demographics Similar to Immigrants from Kenya by In Labor Force | Age 20-64
In terms of in labor force | age 20-64, the demographic groups most similar to Immigrants from Kenya are Immigrants from Uganda (80.7%, a difference of 0.010%), Immigrants from South Central Asia (80.7%, a difference of 0.030%), Immigrants from North Macedonia (80.7%, a difference of 0.030%), Immigrants from Lithuania (80.7%, a difference of 0.050%), and Immigrants from Ireland (80.7%, a difference of 0.060%).
| Demographics | Rating | Rank | In Labor Force | Age 20-64 |
| Thais | 100.0 /100 | #20 | Exceptional 80.9% |
| Liberians | 100.0 /100 | #21 | Exceptional 80.9% |
| Sudanese | 100.0 /100 | #22 | Exceptional 80.8% |
| Immigrants | Bosnia and Herzegovina | 100.0 /100 | #23 | Exceptional 80.8% |
| Immigrants | Morocco | 100.0 /100 | #24 | Exceptional 80.8% |
| Kenyans | 100.0 /100 | #25 | Exceptional 80.8% |
| Immigrants | Serbia | 100.0 /100 | #26 | Exceptional 80.8% |
| Immigrants | Kenya | 99.9 /100 | #27 | Exceptional 80.7% |
| Immigrants | Uganda | 99.9 /100 | #28 | Exceptional 80.7% |
| Immigrants | South Central Asia | 99.9 /100 | #29 | Exceptional 80.7% |
| Immigrants | North Macedonia | 99.9 /100 | #30 | Exceptional 80.7% |
| Immigrants | Lithuania | 99.9 /100 | #31 | Exceptional 80.7% |
| Immigrants | Ireland | 99.9 /100 | #32 | Exceptional 80.7% |
| Chinese | 99.9 /100 | #33 | Exceptional 80.7% |
| Immigrants | Brazil | 99.9 /100 | #34 | Exceptional 80.7% |
Demographics Similar to British West Indians by In Labor Force | Age 20-64
In terms of in labor force | age 20-64, the demographic groups most similar to British West Indians are Bahamian (78.4%, a difference of 0.010%), U.S. Virgin Islander (78.4%, a difference of 0.030%), Spaniard (78.4%, a difference of 0.040%), Pennsylvania German (78.4%, a difference of 0.050%), and West Indian (78.3%, a difference of 0.050%).
| Demographics | Rating | Rank | In Labor Force | Age 20-64 |
| Immigrants | Guatemala | 0.4 /100 | #258 | Tragic 78.7% |
| Tsimshian | 0.4 /100 | #259 | Tragic 78.7% |
| Immigrants | Fiji | 0.3 /100 | #260 | Tragic 78.6% |
| Whites/Caucasians | 0.2 /100 | #261 | Tragic 78.5% |
| Fijians | 0.1 /100 | #262 | Tragic 78.4% |
| Pennsylvania Germans | 0.1 /100 | #263 | Tragic 78.4% |
| Spaniards | 0.1 /100 | #264 | Tragic 78.4% |
| British West Indians | 0.1 /100 | #265 | Tragic 78.4% |
| Bahamians | 0.1 /100 | #266 | Tragic 78.4% |
| U.S. Virgin Islanders | 0.1 /100 | #267 | Tragic 78.4% |
| West Indians | 0.0 /100 | #268 | Tragic 78.3% |
| Immigrants | Barbados | 0.0 /100 | #269 | Tragic 78.3% |
| Scotch-Irish | 0.0 /100 | #270 | Tragic 78.3% |
| Immigrants | Latin America | 0.0 /100 | #271 | Tragic 78.3% |
| Marshallese | 0.0 /100 | #272 | Tragic 78.3% |