Immigrants from Kenya vs Scandinavian In Labor Force | Age 20-64
COMPARE
Immigrants from Kenya
Scandinavian
In Labor Force | Age 20-64
In Labor Force | Age 20-64 Comparison
Immigrants from Kenya
Scandinavians
80.7%
IN LABOR FORCE | AGE 20-64
99.9/ 100
METRIC RATING
27th/ 347
METRIC RANK
79.7%
IN LABOR FORCE | AGE 20-64
72.0/ 100
METRIC RATING
151st/ 347
METRIC RANK
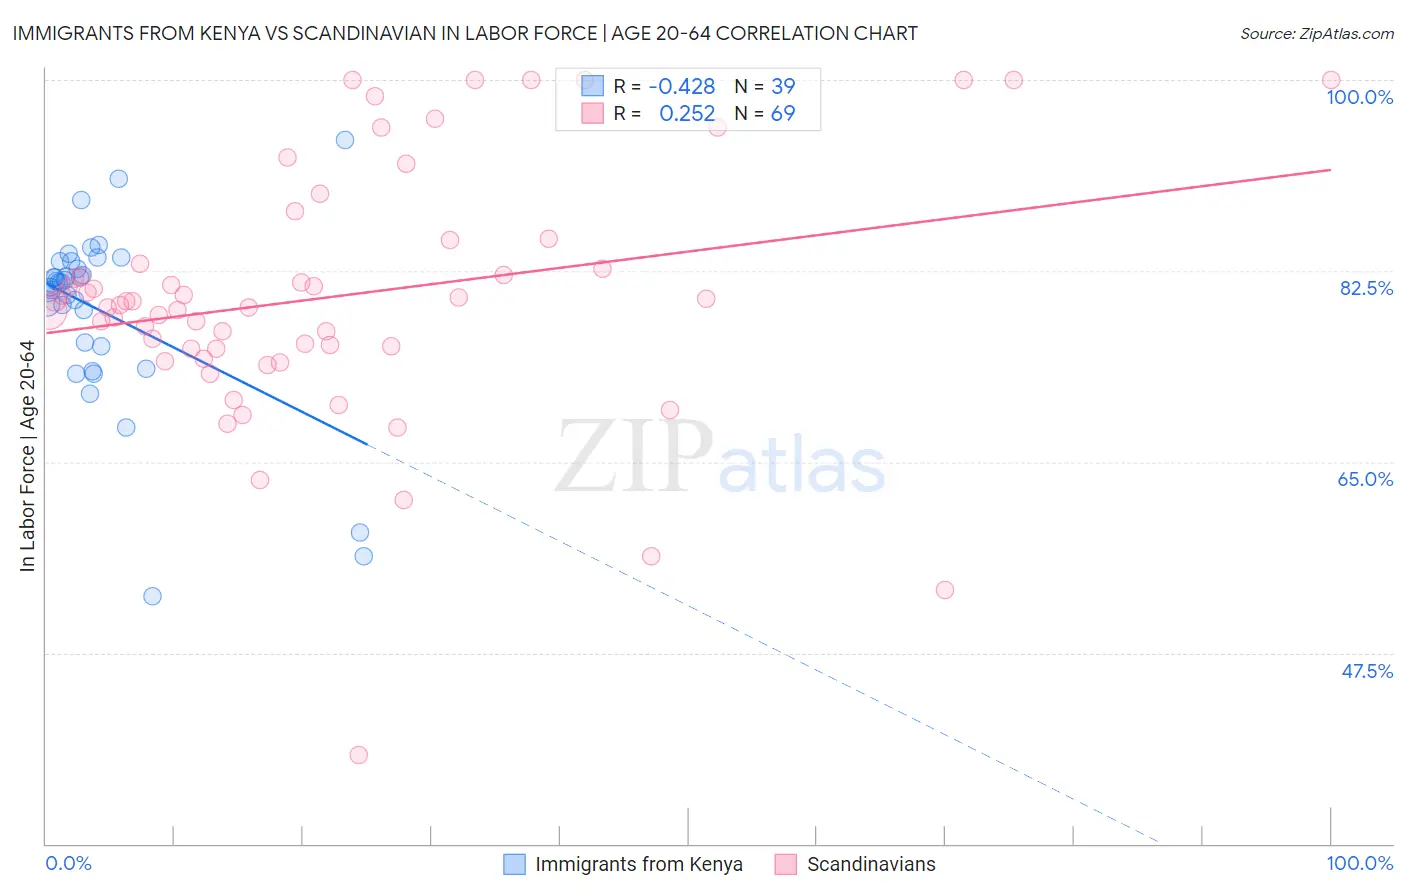
Immigrants from Kenya vs Scandinavian In Labor Force | Age 20-64 Correlation Chart
The statistical analysis conducted on geographies consisting of 218,088,200 people shows a moderate negative correlation between the proportion of Immigrants from Kenya and labor force participation rate among population between the ages 20 and 64 in the United States with a correlation coefficient (R) of -0.428 and weighted average of 80.7%. Similarly, the statistical analysis conducted on geographies consisting of 472,639,714 people shows a weak positive correlation between the proportion of Scandinavians and labor force participation rate among population between the ages 20 and 64 in the United States with a correlation coefficient (R) of 0.252 and weighted average of 79.7%, a difference of 1.3%.
In Labor Force | Age 20-64 Correlation Summary
| Measurement | Immigrants from Kenya | Scandinavian |
| Minimum | 52.7% | 38.1% |
| Maximum | 94.5% | 100.0% |
| Range | 41.8% | 61.9% |
| Mean | 78.8% | 80.1% |
| Median | 81.4% | 79.7% |
| Interquartile 25% (IQ1) | 75.6% | 75.4% |
| Interquartile 75% (IQ3) | 83.4% | 84.3% |
| Interquartile Range (IQR) | 7.9% | 8.9% |
| Standard Deviation (Sample) | 8.4% | 11.6% |
| Standard Deviation (Population) | 8.3% | 11.5% |
Similar Demographics by In Labor Force | Age 20-64
Demographics Similar to Immigrants from Kenya by In Labor Force | Age 20-64
In terms of in labor force | age 20-64, the demographic groups most similar to Immigrants from Kenya are Immigrants from Uganda (80.7%, a difference of 0.010%), Immigrants from South Central Asia (80.7%, a difference of 0.030%), Immigrants from North Macedonia (80.7%, a difference of 0.030%), Immigrants from Lithuania (80.7%, a difference of 0.050%), and Immigrants from Ireland (80.7%, a difference of 0.060%).
| Demographics | Rating | Rank | In Labor Force | Age 20-64 |
| Thais | 100.0 /100 | #20 | Exceptional 80.9% |
| Liberians | 100.0 /100 | #21 | Exceptional 80.9% |
| Sudanese | 100.0 /100 | #22 | Exceptional 80.8% |
| Immigrants | Bosnia and Herzegovina | 100.0 /100 | #23 | Exceptional 80.8% |
| Immigrants | Morocco | 100.0 /100 | #24 | Exceptional 80.8% |
| Kenyans | 100.0 /100 | #25 | Exceptional 80.8% |
| Immigrants | Serbia | 100.0 /100 | #26 | Exceptional 80.8% |
| Immigrants | Kenya | 99.9 /100 | #27 | Exceptional 80.7% |
| Immigrants | Uganda | 99.9 /100 | #28 | Exceptional 80.7% |
| Immigrants | South Central Asia | 99.9 /100 | #29 | Exceptional 80.7% |
| Immigrants | North Macedonia | 99.9 /100 | #30 | Exceptional 80.7% |
| Immigrants | Lithuania | 99.9 /100 | #31 | Exceptional 80.7% |
| Immigrants | Ireland | 99.9 /100 | #32 | Exceptional 80.7% |
| Chinese | 99.9 /100 | #33 | Exceptional 80.7% |
| Immigrants | Brazil | 99.9 /100 | #34 | Exceptional 80.7% |
Demographics Similar to Scandinavians by In Labor Force | Age 20-64
In terms of in labor force | age 20-64, the demographic groups most similar to Scandinavians are Costa Rican (79.7%, a difference of 0.0%), Immigrants from Northern Europe (79.7%, a difference of 0.0%), Immigrants from Kazakhstan (79.7%, a difference of 0.020%), Icelander (79.7%, a difference of 0.030%), and New Zealander (79.7%, a difference of 0.030%).
| Demographics | Rating | Rank | In Labor Force | Age 20-64 |
| Koreans | 79.6 /100 | #144 | Good 79.8% |
| Pakistanis | 79.3 /100 | #145 | Good 79.8% |
| Immigrants | Southern Europe | 78.9 /100 | #146 | Good 79.8% |
| Immigrants | Philippines | 78.0 /100 | #147 | Good 79.8% |
| Romanians | 77.6 /100 | #148 | Good 79.8% |
| Icelanders | 75.1 /100 | #149 | Good 79.7% |
| Costa Ricans | 72.4 /100 | #150 | Good 79.7% |
| Scandinavians | 72.0 /100 | #151 | Good 79.7% |
| Immigrants | Northern Europe | 72.0 /100 | #152 | Good 79.7% |
| Immigrants | Kazakhstan | 69.5 /100 | #153 | Good 79.7% |
| New Zealanders | 69.4 /100 | #154 | Good 79.7% |
| Immigrants | South Africa | 69.2 /100 | #155 | Good 79.7% |
| Senegalese | 69.1 /100 | #156 | Good 79.7% |
| Immigrants | China | 69.1 /100 | #157 | Good 79.7% |
| Austrians | 67.6 /100 | #158 | Good 79.7% |