Immigrants from Iran vs Immigrants from Bahamas College, 1 year or more
COMPARE
Immigrants from Iran
Immigrants from Bahamas
College, 1 year or more
College, 1 year or more Comparison
Immigrants from Iran
Immigrants from Bahamas
69.5%
COLLEGE, 1 YEAR OR MORE
100.0/ 100
METRIC RATING
6th/ 347
METRIC RANK
55.2%
COLLEGE, 1 YEAR OR MORE
0.5/ 100
METRIC RATING
255th/ 347
METRIC RANK
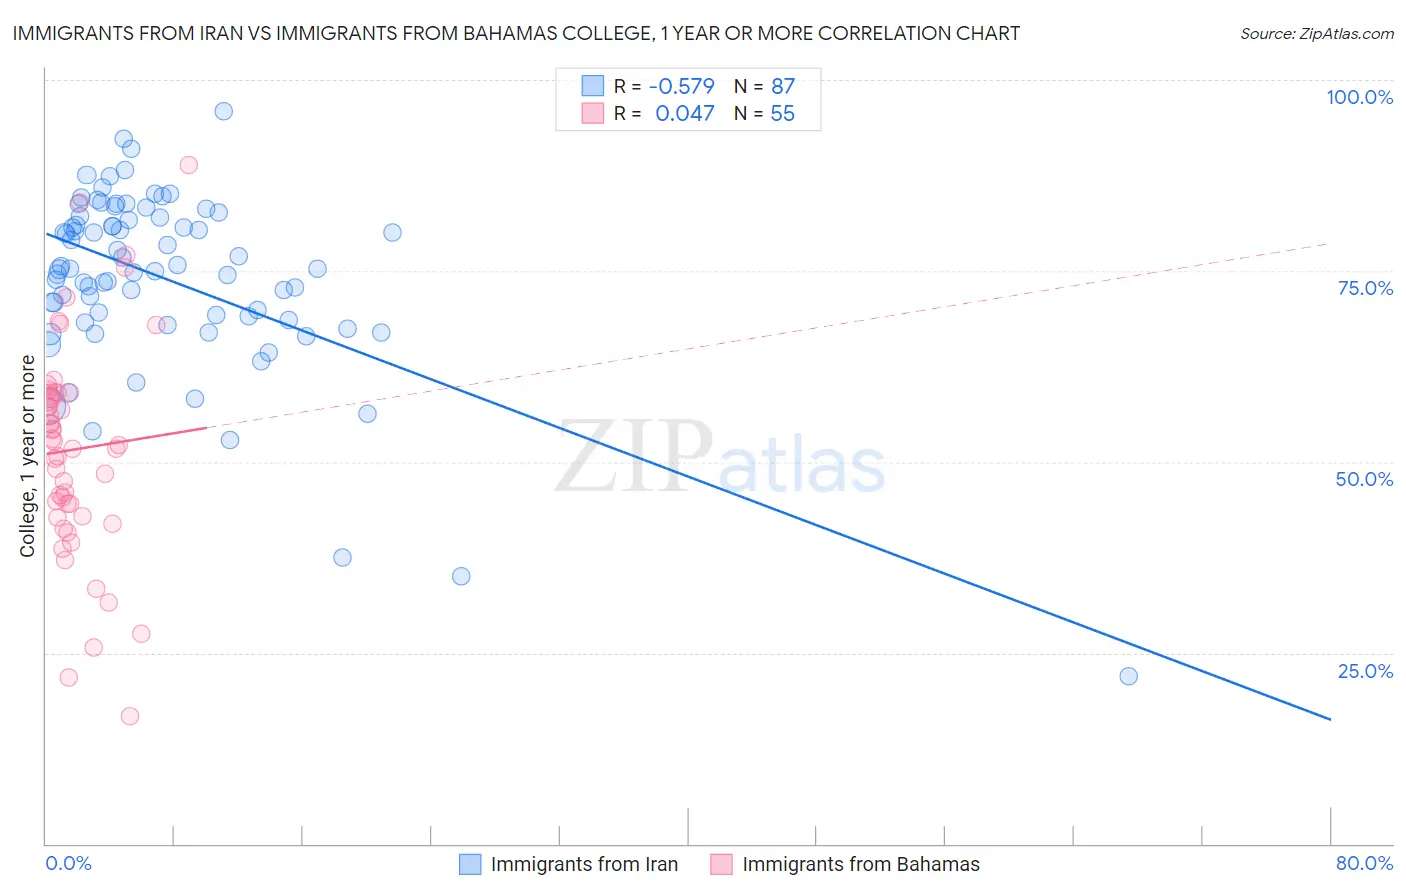
Immigrants from Iran vs Immigrants from Bahamas College, 1 year or more Correlation Chart
The statistical analysis conducted on geographies consisting of 279,905,207 people shows a substantial negative correlation between the proportion of Immigrants from Iran and percentage of population with at least college, 1 year or more education in the United States with a correlation coefficient (R) of -0.579 and weighted average of 69.5%. Similarly, the statistical analysis conducted on geographies consisting of 104,668,341 people shows no correlation between the proportion of Immigrants from Bahamas and percentage of population with at least college, 1 year or more education in the United States with a correlation coefficient (R) of 0.047 and weighted average of 55.2%, a difference of 25.9%.
College, 1 year or more Correlation Summary
| Measurement | Immigrants from Iran | Immigrants from Bahamas |
| Minimum | 22.0% | 16.6% |
| Maximum | 96.0% | 88.9% |
| Range | 74.0% | 72.2% |
| Mean | 74.0% | 51.6% |
| Median | 75.3% | 52.3% |
| Interquartile 25% (IQ1) | 68.5% | 42.8% |
| Interquartile 75% (IQ3) | 82.0% | 59.0% |
| Interquartile Range (IQR) | 13.4% | 16.2% |
| Standard Deviation (Sample) | 12.0% | 14.2% |
| Standard Deviation (Population) | 11.9% | 14.1% |
Similar Demographics by College, 1 year or more
Demographics Similar to Immigrants from Iran by College, 1 year or more
In terms of college, 1 year or more, the demographic groups most similar to Immigrants from Iran are Immigrants from Taiwan (69.6%, a difference of 0.20%), Immigrants from India (69.6%, a difference of 0.20%), Iranian (70.0%, a difference of 0.70%), Okinawan (69.0%, a difference of 0.77%), and Immigrants from Singapore (70.1%, a difference of 0.92%).
| Demographics | Rating | Rank | College, 1 year or more |
| Filipinos | 100.0 /100 | #1 | Exceptional 71.0% |
| Immigrants | Singapore | 100.0 /100 | #2 | Exceptional 70.1% |
| Iranians | 100.0 /100 | #3 | Exceptional 70.0% |
| Immigrants | Taiwan | 100.0 /100 | #4 | Exceptional 69.6% |
| Immigrants | India | 100.0 /100 | #5 | Exceptional 69.6% |
| Immigrants | Iran | 100.0 /100 | #6 | Exceptional 69.5% |
| Okinawans | 100.0 /100 | #7 | Exceptional 69.0% |
| Thais | 100.0 /100 | #8 | Exceptional 68.6% |
| Immigrants | Israel | 100.0 /100 | #9 | Exceptional 67.8% |
| Immigrants | Australia | 100.0 /100 | #10 | Exceptional 67.7% |
| Immigrants | South Central Asia | 100.0 /100 | #11 | Exceptional 67.1% |
| Cypriots | 100.0 /100 | #12 | Exceptional 67.0% |
| Immigrants | Sweden | 100.0 /100 | #13 | Exceptional 66.8% |
| Burmese | 100.0 /100 | #14 | Exceptional 66.7% |
| Cambodians | 100.0 /100 | #15 | Exceptional 66.7% |
Demographics Similar to Immigrants from Bahamas by College, 1 year or more
In terms of college, 1 year or more, the demographic groups most similar to Immigrants from Bahamas are Japanese (55.2%, a difference of 0.050%), Immigrants from West Indies (55.2%, a difference of 0.080%), Indonesian (55.1%, a difference of 0.17%), Immigrants from Barbados (55.4%, a difference of 0.30%), and Aleut (55.4%, a difference of 0.40%).
| Demographics | Rating | Rank | College, 1 year or more |
| Immigrants | Congo | 0.8 /100 | #248 | Tragic 55.6% |
| Immigrants | Trinidad and Tobago | 0.7 /100 | #249 | Tragic 55.5% |
| Delaware | 0.7 /100 | #250 | Tragic 55.5% |
| Immigrants | Cambodia | 0.6 /100 | #251 | Tragic 55.4% |
| Aleuts | 0.6 /100 | #252 | Tragic 55.4% |
| Immigrants | Barbados | 0.6 /100 | #253 | Tragic 55.4% |
| Japanese | 0.5 /100 | #254 | Tragic 55.2% |
| Immigrants | Bahamas | 0.5 /100 | #255 | Tragic 55.2% |
| Immigrants | West Indies | 0.5 /100 | #256 | Tragic 55.2% |
| Indonesians | 0.4 /100 | #257 | Tragic 55.1% |
| Africans | 0.4 /100 | #258 | Tragic 55.0% |
| Nepalese | 0.3 /100 | #259 | Tragic 54.9% |
| Jamaicans | 0.3 /100 | #260 | Tragic 54.9% |
| Ottawa | 0.3 /100 | #261 | Tragic 54.9% |
| Immigrants | St. Vincent and the Grenadines | 0.3 /100 | #262 | Tragic 54.8% |