Subsaharan African vs Immigrants from Bahamas In Labor Force | Age 20-24
COMPARE
Subsaharan African
Immigrants from Bahamas
In Labor Force | Age 20-24
In Labor Force | Age 20-24 Comparison
Sub-Saharan Africans
Immigrants from Bahamas
75.7%
IN LABOR FORCE | AGE 20-24
90.9/ 100
METRIC RATING
127th/ 347
METRIC RANK
73.2%
IN LABOR FORCE | AGE 20-24
0.1/ 100
METRIC RATING
283rd/ 347
METRIC RANK
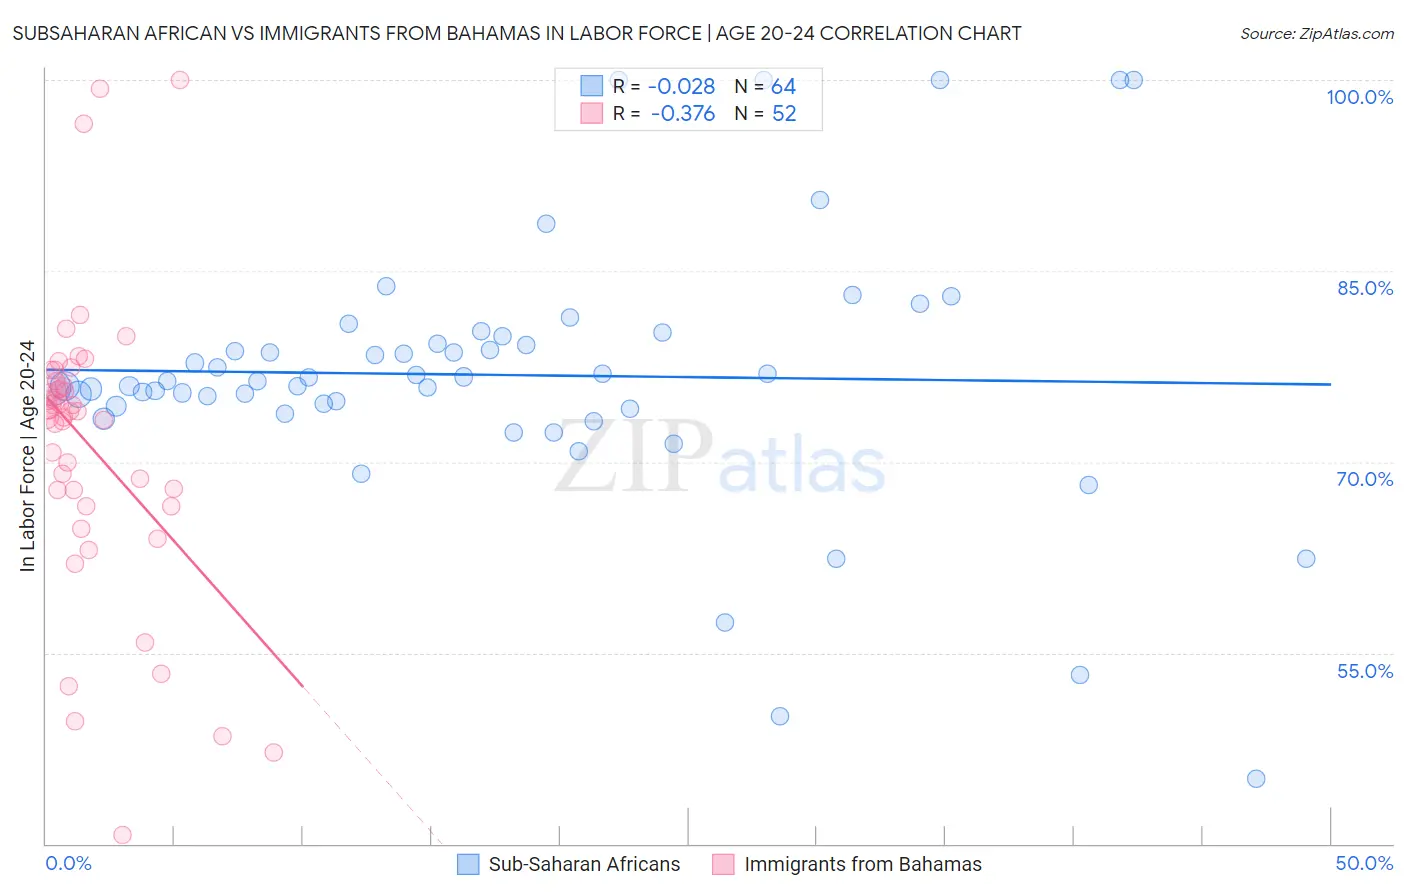
Subsaharan African vs Immigrants from Bahamas In Labor Force | Age 20-24 Correlation Chart
The statistical analysis conducted on geographies consisting of 507,882,166 people shows no correlation between the proportion of Sub-Saharan Africans and labor force participation rate among population between the ages 20 and 24 in the United States with a correlation coefficient (R) of -0.028 and weighted average of 75.7%. Similarly, the statistical analysis conducted on geographies consisting of 104,660,566 people shows a mild negative correlation between the proportion of Immigrants from Bahamas and labor force participation rate among population between the ages 20 and 24 in the United States with a correlation coefficient (R) of -0.376 and weighted average of 73.2%, a difference of 3.4%.
In Labor Force | Age 20-24 Correlation Summary
| Measurement | Subsaharan African | Immigrants from Bahamas |
| Minimum | 45.1% | 40.7% |
| Maximum | 100.0% | 100.0% |
| Range | 54.9% | 59.3% |
| Mean | 76.8% | 71.4% |
| Median | 76.3% | 74.0% |
| Interquartile 25% (IQ1) | 74.3% | 67.2% |
| Interquartile 75% (IQ3) | 79.6% | 76.2% |
| Interquartile Range (IQR) | 5.3% | 9.0% |
| Standard Deviation (Sample) | 10.3% | 11.5% |
| Standard Deviation (Population) | 10.2% | 11.4% |
Similar Demographics by In Labor Force | Age 20-24
Demographics Similar to Sub-Saharan Africans by In Labor Force | Age 20-24
In terms of in labor force | age 20-24, the demographic groups most similar to Sub-Saharan Africans are Immigrants from Afghanistan (75.6%, a difference of 0.060%), Iroquois (75.6%, a difference of 0.070%), Immigrants from Austria (75.6%, a difference of 0.080%), Immigrants from Jordan (75.6%, a difference of 0.090%), and Palestinian (75.6%, a difference of 0.10%).
| Demographics | Rating | Rank | In Labor Force | Age 20-24 |
| Immigrants | Africa | 94.6 /100 | #120 | Exceptional 75.8% |
| Immigrants | Serbia | 94.3 /100 | #121 | Exceptional 75.8% |
| Pakistanis | 94.1 /100 | #122 | Exceptional 75.8% |
| Immigrants | Bulgaria | 94.1 /100 | #123 | Exceptional 75.8% |
| Immigrants | Sierra Leone | 93.8 /100 | #124 | Exceptional 75.8% |
| Immigrants | Scotland | 93.7 /100 | #125 | Exceptional 75.8% |
| Brazilians | 93.0 /100 | #126 | Exceptional 75.8% |
| Sub-Saharan Africans | 90.9 /100 | #127 | Exceptional 75.7% |
| Immigrants | Afghanistan | 89.4 /100 | #128 | Excellent 75.6% |
| Iroquois | 89.1 /100 | #129 | Excellent 75.6% |
| Immigrants | Austria | 88.8 /100 | #130 | Excellent 75.6% |
| Immigrants | Jordan | 88.5 /100 | #131 | Excellent 75.6% |
| Palestinians | 88.4 /100 | #132 | Excellent 75.6% |
| Zimbabweans | 88.2 /100 | #133 | Excellent 75.6% |
| Estonians | 87.1 /100 | #134 | Excellent 75.6% |
Demographics Similar to Immigrants from Bahamas by In Labor Force | Age 20-24
In terms of in labor force | age 20-24, the demographic groups most similar to Immigrants from Bahamas are Immigrants from Venezuela (73.2%, a difference of 0.010%), Immigrants from Spain (73.2%, a difference of 0.010%), Kiowa (73.2%, a difference of 0.020%), Bahamian (73.3%, a difference of 0.050%), and Nicaraguan (73.2%, a difference of 0.080%).
| Demographics | Rating | Rank | In Labor Force | Age 20-24 |
| Mongolians | 0.2 /100 | #276 | Tragic 73.3% |
| Immigrants | Malaysia | 0.2 /100 | #277 | Tragic 73.3% |
| Cypriots | 0.2 /100 | #278 | Tragic 73.3% |
| Venezuelans | 0.2 /100 | #279 | Tragic 73.3% |
| Bahamians | 0.1 /100 | #280 | Tragic 73.3% |
| Immigrants | Venezuela | 0.1 /100 | #281 | Tragic 73.2% |
| Immigrants | Spain | 0.1 /100 | #282 | Tragic 73.2% |
| Immigrants | Bahamas | 0.1 /100 | #283 | Tragic 73.2% |
| Kiowa | 0.1 /100 | #284 | Tragic 73.2% |
| Nicaraguans | 0.1 /100 | #285 | Tragic 73.2% |
| Immigrants | Lebanon | 0.1 /100 | #286 | Tragic 73.1% |
| Immigrants | Korea | 0.1 /100 | #287 | Tragic 73.1% |
| Argentineans | 0.1 /100 | #288 | Tragic 73.1% |
| U.S. Virgin Islanders | 0.1 /100 | #289 | Tragic 73.0% |
| Immigrants | Belarus | 0.1 /100 | #290 | Tragic 73.0% |