Immigrants from Iran vs Immigrants from Bahamas Family Households
COMPARE
Immigrants from Iran
Immigrants from Bahamas
Family Households
Family Households Comparison
Immigrants from Iran
Immigrants from Bahamas
64.1%
FAMILY HOUSEHOLDS
30.4/ 100
METRIC RATING
185th/ 347
METRIC RANK
63.6%
FAMILY HOUSEHOLDS
4.2/ 100
METRIC RATING
226th/ 347
METRIC RANK
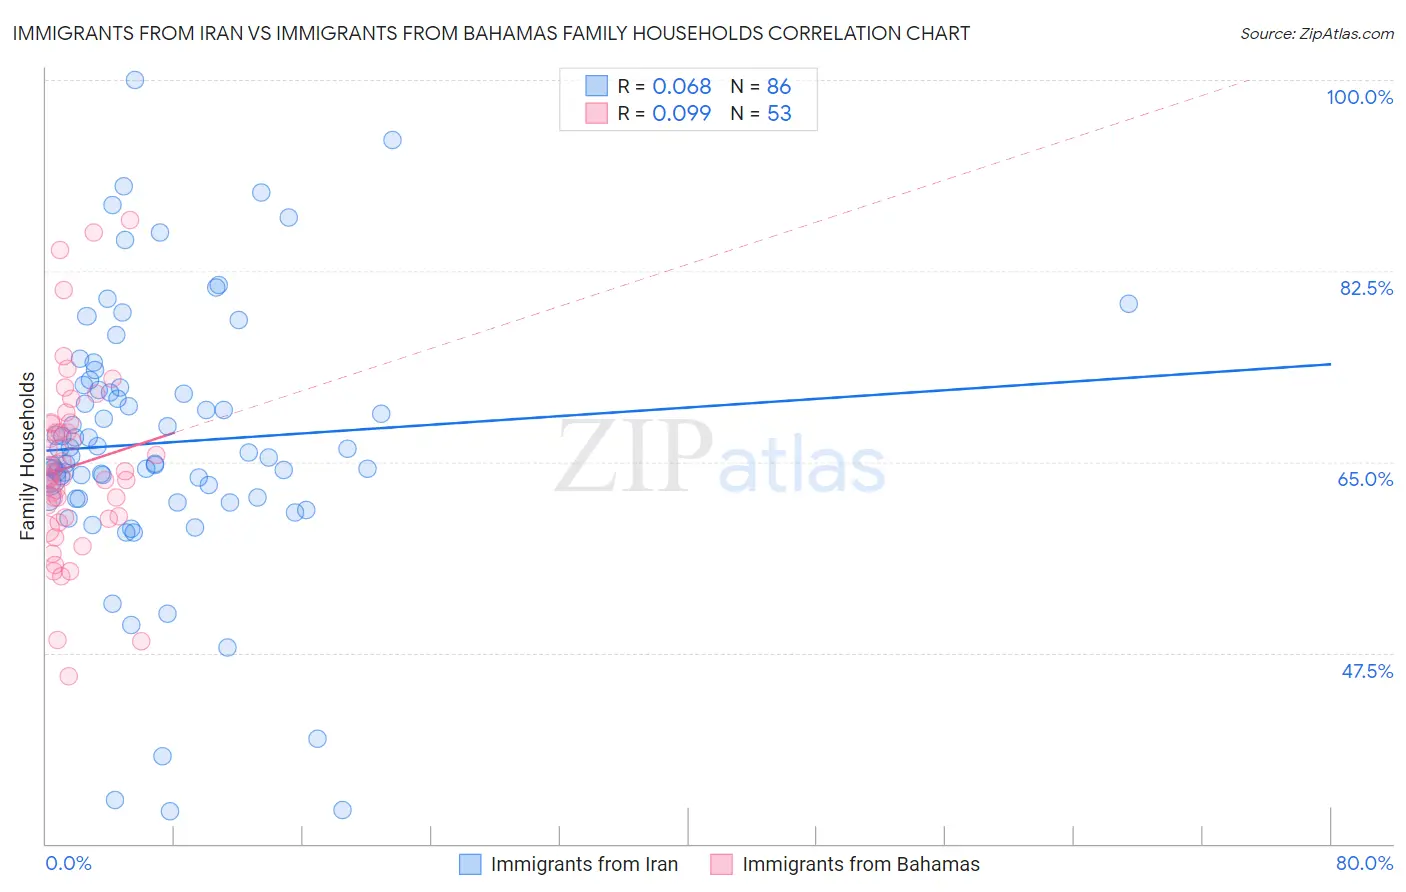
Immigrants from Iran vs Immigrants from Bahamas Family Households Correlation Chart
The statistical analysis conducted on geographies consisting of 279,831,456 people shows a slight positive correlation between the proportion of Immigrants from Iran and percentage of family households in the United States with a correlation coefficient (R) of 0.068 and weighted average of 64.1%. Similarly, the statistical analysis conducted on geographies consisting of 104,610,461 people shows a slight positive correlation between the proportion of Immigrants from Bahamas and percentage of family households in the United States with a correlation coefficient (R) of 0.099 and weighted average of 63.6%, a difference of 0.78%.
Family Households Correlation Summary
| Measurement | Immigrants from Iran | Immigrants from Bahamas |
| Minimum | 33.0% | 45.4% |
| Maximum | 100.0% | 87.2% |
| Range | 67.0% | 41.8% |
| Mean | 66.7% | 64.6% |
| Median | 65.7% | 63.6% |
| Interquartile 25% (IQ1) | 61.7% | 59.9% |
| Interquartile 75% (IQ3) | 71.8% | 68.5% |
| Interquartile Range (IQR) | 10.2% | 8.7% |
| Standard Deviation (Sample) | 12.3% | 8.4% |
| Standard Deviation (Population) | 12.3% | 8.4% |
Similar Demographics by Family Households
Demographics Similar to Immigrants from Iran by Family Households
In terms of family households, the demographic groups most similar to Immigrants from Iran are Spanish American (64.1%, a difference of 0.010%), Northern European (64.1%, a difference of 0.040%), Puerto Rican (64.2%, a difference of 0.050%), Ukrainian (64.2%, a difference of 0.060%), and Creek (64.2%, a difference of 0.060%).
| Demographics | Rating | Rank | Family Households |
| Jamaicans | 40.6 /100 | #178 | Average 64.2% |
| Immigrants | Ukraine | 38.2 /100 | #179 | Fair 64.2% |
| Immigrants | Honduras | 35.0 /100 | #180 | Fair 64.2% |
| Immigrants | Trinidad and Tobago | 34.9 /100 | #181 | Fair 64.2% |
| Ukrainians | 34.6 /100 | #182 | Fair 64.2% |
| Creek | 34.1 /100 | #183 | Fair 64.2% |
| Puerto Ricans | 33.4 /100 | #184 | Fair 64.2% |
| Immigrants | Iran | 30.4 /100 | #185 | Fair 64.1% |
| Spanish Americans | 30.1 /100 | #186 | Fair 64.1% |
| Northern Europeans | 28.2 /100 | #187 | Fair 64.1% |
| Paraguayans | 26.7 /100 | #188 | Fair 64.1% |
| Immigrants | Western Asia | 25.3 /100 | #189 | Fair 64.1% |
| Zimbabweans | 24.7 /100 | #190 | Fair 64.1% |
| Arabs | 24.5 /100 | #191 | Fair 64.1% |
| Lithuanians | 23.8 /100 | #192 | Fair 64.0% |
Demographics Similar to Immigrants from Bahamas by Family Households
In terms of family households, the demographic groups most similar to Immigrants from Bahamas are Immigrants from Hungary (63.6%, a difference of 0.010%), Trinidadian and Tobagonian (63.6%, a difference of 0.010%), Turkish (63.6%, a difference of 0.020%), Blackfeet (63.6%, a difference of 0.060%), and Bulgarian (63.6%, a difference of 0.070%).
| Demographics | Rating | Rank | Family Households |
| Macedonians | 6.5 /100 | #219 | Tragic 63.7% |
| Immigrants | Europe | 6.4 /100 | #220 | Tragic 63.7% |
| Immigrants | South Africa | 5.9 /100 | #221 | Tragic 63.7% |
| Immigrants | Belarus | 5.5 /100 | #222 | Tragic 63.7% |
| French Canadians | 5.4 /100 | #223 | Tragic 63.7% |
| Turks | 4.5 /100 | #224 | Tragic 63.6% |
| Immigrants | Hungary | 4.3 /100 | #225 | Tragic 63.6% |
| Immigrants | Bahamas | 4.2 /100 | #226 | Tragic 63.6% |
| Trinidadians and Tobagonians | 4.1 /100 | #227 | Tragic 63.6% |
| Blackfeet | 3.6 /100 | #228 | Tragic 63.6% |
| Bulgarians | 3.4 /100 | #229 | Tragic 63.6% |
| Immigrants | Brazil | 3.0 /100 | #230 | Tragic 63.6% |
| Immigrants | Greece | 2.9 /100 | #231 | Tragic 63.5% |
| Immigrants | Northern Africa | 2.6 /100 | #232 | Tragic 63.5% |
| Immigrants | Armenia | 2.6 /100 | #233 | Tragic 63.5% |