Navajo vs Immigrants from Bahamas In Labor Force | Age 20-24
COMPARE
Navajo
Immigrants from Bahamas
In Labor Force | Age 20-24
In Labor Force | Age 20-24 Comparison
Navajo
Immigrants from Bahamas
64.8%
IN LABOR FORCE | AGE 20-24
0.0/ 100
METRIC RATING
347th/ 347
METRIC RANK
73.2%
IN LABOR FORCE | AGE 20-24
0.1/ 100
METRIC RATING
283rd/ 347
METRIC RANK
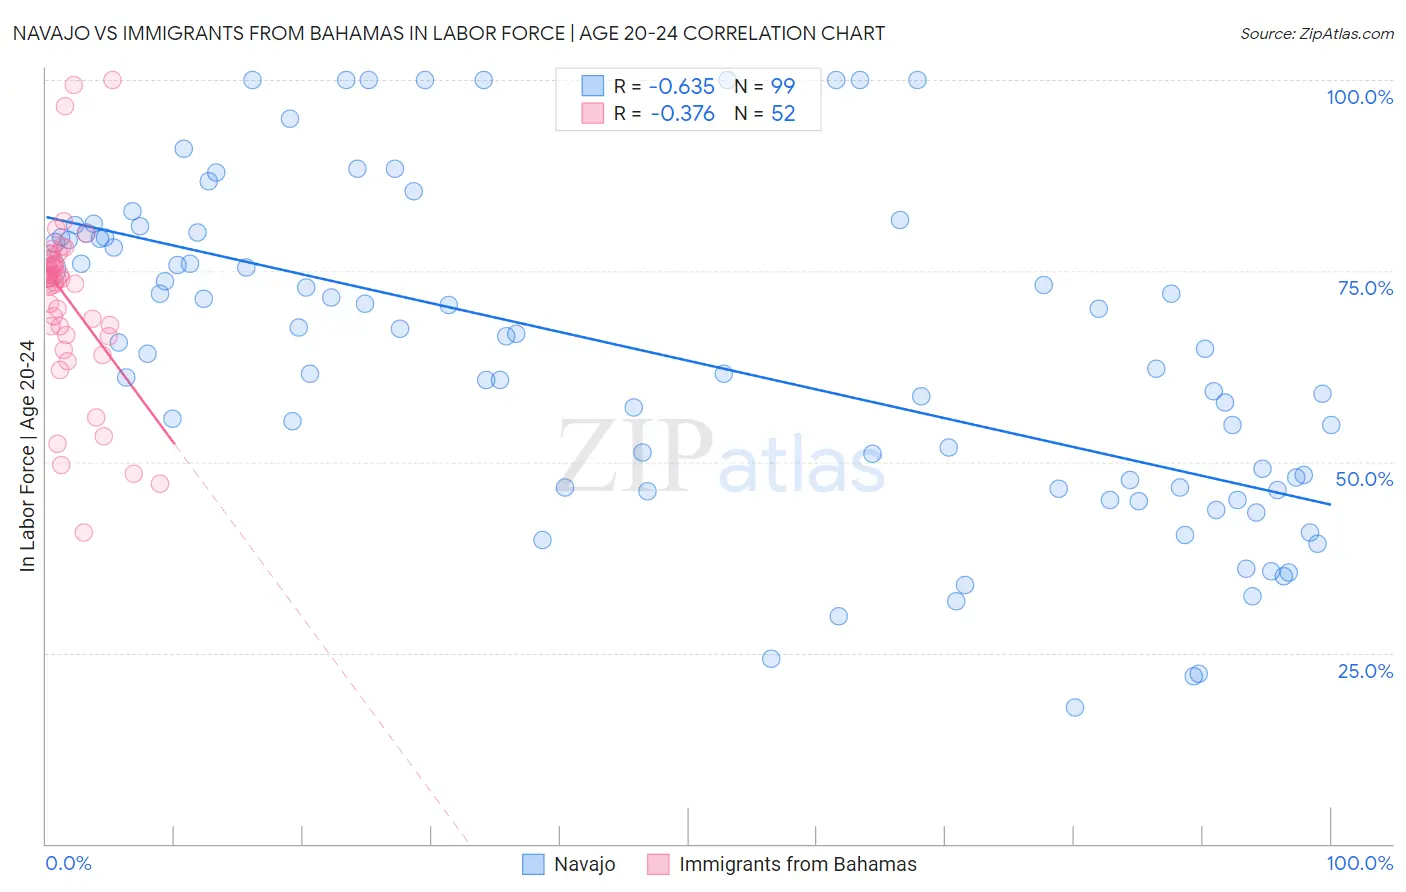
Navajo vs Immigrants from Bahamas In Labor Force | Age 20-24 Correlation Chart
The statistical analysis conducted on geographies consisting of 224,781,788 people shows a significant negative correlation between the proportion of Navajo and labor force participation rate among population between the ages 20 and 24 in the United States with a correlation coefficient (R) of -0.635 and weighted average of 64.8%. Similarly, the statistical analysis conducted on geographies consisting of 104,660,566 people shows a mild negative correlation between the proportion of Immigrants from Bahamas and labor force participation rate among population between the ages 20 and 24 in the United States with a correlation coefficient (R) of -0.376 and weighted average of 73.2%, a difference of 12.9%.
In Labor Force | Age 20-24 Correlation Summary
| Measurement | Navajo | Immigrants from Bahamas |
| Minimum | 17.9% | 40.7% |
| Maximum | 100.0% | 100.0% |
| Range | 82.1% | 59.3% |
| Mean | 63.8% | 71.4% |
| Median | 64.7% | 74.0% |
| Interquartile 25% (IQ1) | 46.6% | 67.2% |
| Interquartile 75% (IQ3) | 79.4% | 76.2% |
| Interquartile Range (IQR) | 32.8% | 9.0% |
| Standard Deviation (Sample) | 21.0% | 11.5% |
| Standard Deviation (Population) | 20.9% | 11.4% |
Similar Demographics by In Labor Force | Age 20-24
Demographics Similar to Navajo by In Labor Force | Age 20-24
In terms of in labor force | age 20-24, the demographic groups most similar to Navajo are Lumbee (65.5%, a difference of 1.1%), Hopi (66.0%, a difference of 1.8%), Immigrants from Grenada (67.2%, a difference of 3.6%), Puerto Rican (68.3%, a difference of 5.4%), and Immigrants from St. Vincent and the Grenadines (68.4%, a difference of 5.5%).
| Demographics | Rating | Rank | In Labor Force | Age 20-24 |
| Yuman | 0.0 /100 | #333 | Tragic 70.3% |
| British West Indians | 0.0 /100 | #334 | Tragic 70.0% |
| Immigrants | Barbados | 0.0 /100 | #335 | Tragic 69.7% |
| Immigrants | Guyana | 0.0 /100 | #336 | Tragic 69.3% |
| Guyanese | 0.0 /100 | #337 | Tragic 69.2% |
| Pima | 0.0 /100 | #338 | Tragic 69.0% |
| Immigrants | Yemen | 0.0 /100 | #339 | Tragic 68.9% |
| Menominee | 0.0 /100 | #340 | Tragic 68.7% |
| Tohono O'odham | 0.0 /100 | #341 | Tragic 68.6% |
| Immigrants | St. Vincent and the Grenadines | 0.0 /100 | #342 | Tragic 68.4% |
| Puerto Ricans | 0.0 /100 | #343 | Tragic 68.3% |
| Immigrants | Grenada | 0.0 /100 | #344 | Tragic 67.2% |
| Hopi | 0.0 /100 | #345 | Tragic 66.0% |
| Lumbee | 0.0 /100 | #346 | Tragic 65.5% |
| Navajo | 0.0 /100 | #347 | Tragic 64.8% |
Demographics Similar to Immigrants from Bahamas by In Labor Force | Age 20-24
In terms of in labor force | age 20-24, the demographic groups most similar to Immigrants from Bahamas are Immigrants from Venezuela (73.2%, a difference of 0.010%), Immigrants from Spain (73.2%, a difference of 0.010%), Kiowa (73.2%, a difference of 0.020%), Bahamian (73.3%, a difference of 0.050%), and Nicaraguan (73.2%, a difference of 0.080%).
| Demographics | Rating | Rank | In Labor Force | Age 20-24 |
| Mongolians | 0.2 /100 | #276 | Tragic 73.3% |
| Immigrants | Malaysia | 0.2 /100 | #277 | Tragic 73.3% |
| Cypriots | 0.2 /100 | #278 | Tragic 73.3% |
| Venezuelans | 0.2 /100 | #279 | Tragic 73.3% |
| Bahamians | 0.1 /100 | #280 | Tragic 73.3% |
| Immigrants | Venezuela | 0.1 /100 | #281 | Tragic 73.2% |
| Immigrants | Spain | 0.1 /100 | #282 | Tragic 73.2% |
| Immigrants | Bahamas | 0.1 /100 | #283 | Tragic 73.2% |
| Kiowa | 0.1 /100 | #284 | Tragic 73.2% |
| Nicaraguans | 0.1 /100 | #285 | Tragic 73.2% |
| Immigrants | Lebanon | 0.1 /100 | #286 | Tragic 73.1% |
| Immigrants | Korea | 0.1 /100 | #287 | Tragic 73.1% |
| Argentineans | 0.1 /100 | #288 | Tragic 73.1% |
| U.S. Virgin Islanders | 0.1 /100 | #289 | Tragic 73.0% |
| Immigrants | Belarus | 0.1 /100 | #290 | Tragic 73.0% |