Immigrants from Honduras vs Hopi In Labor Force | Age > 16
COMPARE
Immigrants from Honduras
Hopi
In Labor Force | Age > 16
In Labor Force | Age > 16 Comparison
Immigrants from Honduras
Hopi
65.8%
IN LABOR FORCE | AGE > 16
97.5/ 100
METRIC RATING
111th/ 347
METRIC RANK
58.4%
IN LABOR FORCE | AGE > 16
0.0/ 100
METRIC RATING
341st/ 347
METRIC RANK
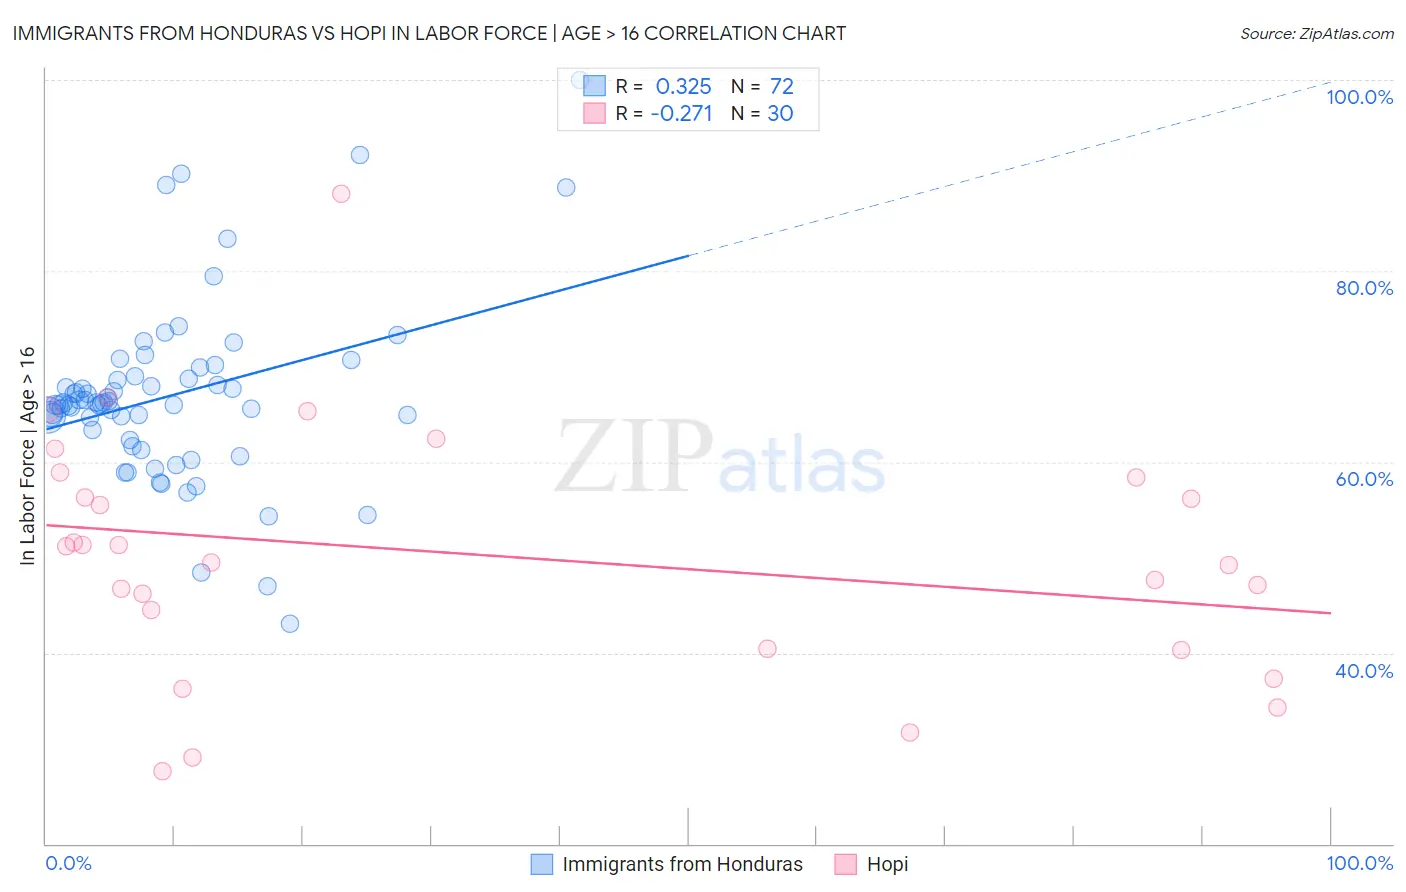
Immigrants from Honduras vs Hopi In Labor Force | Age > 16 Correlation Chart
The statistical analysis conducted on geographies consisting of 322,603,384 people shows a mild positive correlation between the proportion of Immigrants from Honduras and labor force participation rate among population ages 16 and over in the United States with a correlation coefficient (R) of 0.325 and weighted average of 65.8%. Similarly, the statistical analysis conducted on geographies consisting of 74,733,532 people shows a weak negative correlation between the proportion of Hopi and labor force participation rate among population ages 16 and over in the United States with a correlation coefficient (R) of -0.271 and weighted average of 58.4%, a difference of 12.7%.
In Labor Force | Age > 16 Correlation Summary
| Measurement | Immigrants from Honduras | Hopi |
| Minimum | 43.1% | 27.6% |
| Maximum | 100.0% | 88.1% |
| Range | 56.9% | 60.5% |
| Mean | 66.9% | 50.2% |
| Median | 66.1% | 50.4% |
| Interquartile 25% (IQ1) | 62.8% | 40.4% |
| Interquartile 75% (IQ3) | 68.8% | 58.3% |
| Interquartile Range (IQR) | 6.0% | 17.9% |
| Standard Deviation (Sample) | 9.5% | 13.0% |
| Standard Deviation (Population) | 9.4% | 12.8% |
Similar Demographics by In Labor Force | Age > 16
Demographics Similar to Immigrants from Honduras by In Labor Force | Age > 16
In terms of in labor force | age > 16, the demographic groups most similar to Immigrants from Honduras are Japanese (65.8%, a difference of 0.020%), Laotian (65.8%, a difference of 0.020%), Pakistani (65.8%, a difference of 0.040%), Honduran (65.8%, a difference of 0.050%), and Immigrants from Spain (65.8%, a difference of 0.060%).
| Demographics | Rating | Rank | In Labor Force | Age > 16 |
| Palestinians | 98.5 /100 | #104 | Exceptional 65.9% |
| Colombians | 98.4 /100 | #105 | Exceptional 65.9% |
| Immigrants | Serbia | 98.1 /100 | #106 | Exceptional 65.8% |
| Immigrants | Poland | 98.1 /100 | #107 | Exceptional 65.8% |
| Immigrants | Spain | 98.0 /100 | #108 | Exceptional 65.8% |
| Immigrants | Japan | 98.0 /100 | #109 | Exceptional 65.8% |
| Japanese | 97.7 /100 | #110 | Exceptional 65.8% |
| Immigrants | Honduras | 97.5 /100 | #111 | Exceptional 65.8% |
| Laotians | 97.4 /100 | #112 | Exceptional 65.8% |
| Pakistanis | 97.1 /100 | #113 | Exceptional 65.8% |
| Hondurans | 97.1 /100 | #114 | Exceptional 65.8% |
| Immigrants | Indonesia | 96.8 /100 | #115 | Exceptional 65.7% |
| Argentineans | 96.7 /100 | #116 | Exceptional 65.7% |
| Immigrants | Iran | 96.6 /100 | #117 | Exceptional 65.7% |
| Immigrants | Thailand | 96.6 /100 | #118 | Exceptional 65.7% |
Demographics Similar to Hopi by In Labor Force | Age > 16
In terms of in labor force | age > 16, the demographic groups most similar to Hopi are Puerto Rican (58.1%, a difference of 0.47%), Yuman (57.8%, a difference of 0.99%), Pueblo (59.3%, a difference of 1.5%), Pima (57.4%, a difference of 1.7%), and Houma (59.5%, a difference of 1.9%).
| Demographics | Rating | Rank | In Labor Force | Age > 16 |
| Paiute | 0.0 /100 | #333 | Tragic 60.7% |
| Apache | 0.0 /100 | #334 | Tragic 60.7% |
| Natives/Alaskans | 0.0 /100 | #335 | Tragic 60.6% |
| Menominee | 0.0 /100 | #336 | Tragic 60.6% |
| Colville | 0.0 /100 | #337 | Tragic 59.8% |
| Immigrants | Yemen | 0.0 /100 | #338 | Tragic 59.6% |
| Houma | 0.0 /100 | #339 | Tragic 59.5% |
| Pueblo | 0.0 /100 | #340 | Tragic 59.3% |
| Hopi | 0.0 /100 | #341 | Tragic 58.4% |
| Puerto Ricans | 0.0 /100 | #342 | Tragic 58.1% |
| Yuman | 0.0 /100 | #343 | Tragic 57.8% |
| Pima | 0.0 /100 | #344 | Tragic 57.4% |
| Tohono O'odham | 0.0 /100 | #345 | Tragic 57.2% |
| Lumbee | 0.0 /100 | #346 | Tragic 56.8% |
| Navajo | 0.0 /100 | #347 | Tragic 56.6% |