Italian vs Hopi In Labor Force | Age > 16
COMPARE
Italian
Hopi
In Labor Force | Age > 16
In Labor Force | Age > 16 Comparison
Italians
Hopi
64.6%
IN LABOR FORCE | AGE > 16
4.6/ 100
METRIC RATING
237th/ 347
METRIC RANK
58.4%
IN LABOR FORCE | AGE > 16
0.0/ 100
METRIC RATING
341st/ 347
METRIC RANK
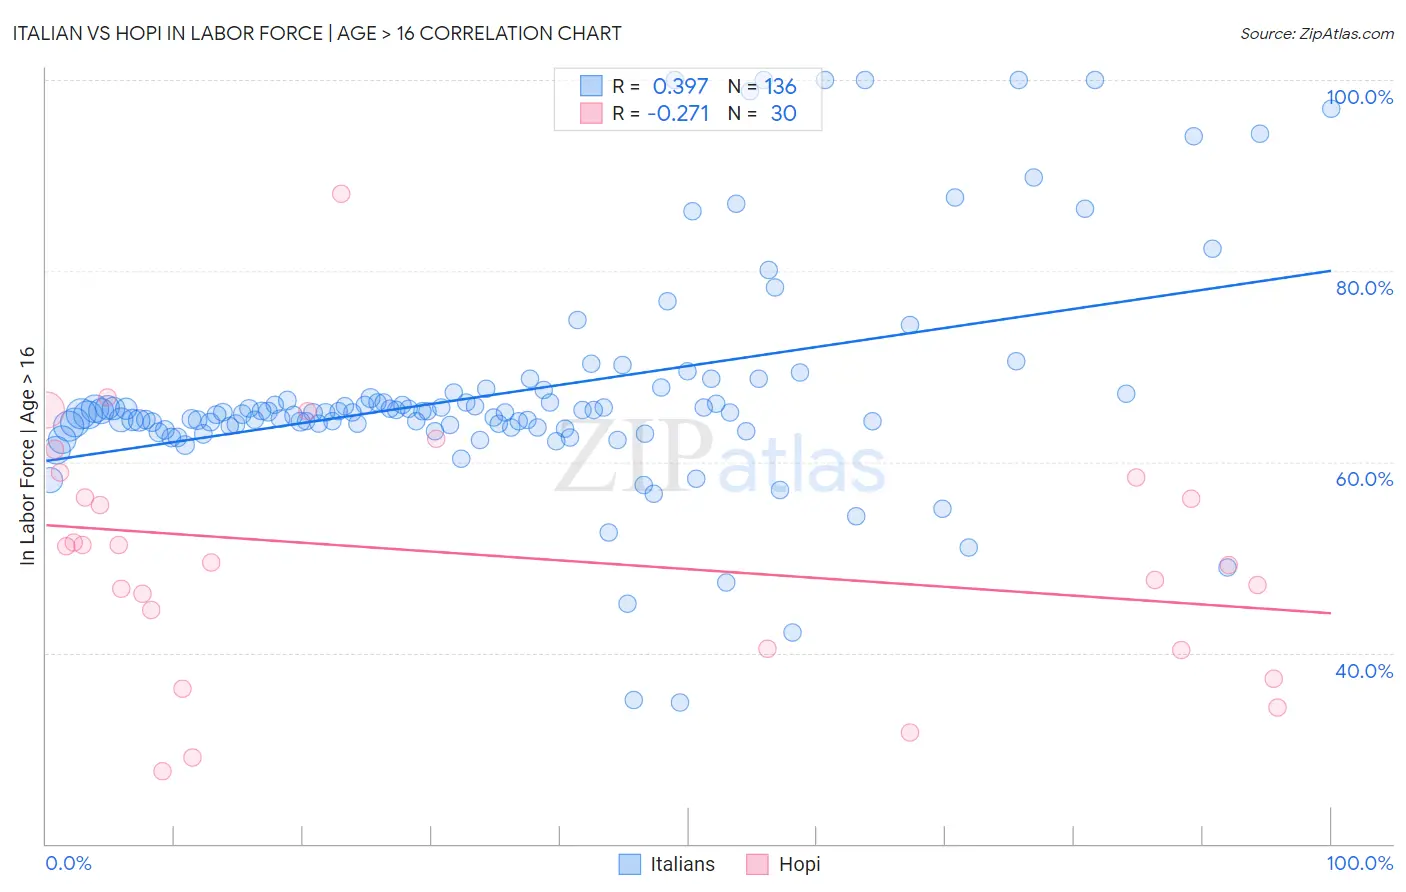
Italian vs Hopi In Labor Force | Age > 16 Correlation Chart
The statistical analysis conducted on geographies consisting of 575,110,373 people shows a mild positive correlation between the proportion of Italians and labor force participation rate among population ages 16 and over in the United States with a correlation coefficient (R) of 0.397 and weighted average of 64.6%. Similarly, the statistical analysis conducted on geographies consisting of 74,733,532 people shows a weak negative correlation between the proportion of Hopi and labor force participation rate among population ages 16 and over in the United States with a correlation coefficient (R) of -0.271 and weighted average of 58.4%, a difference of 10.6%.
In Labor Force | Age > 16 Correlation Summary
| Measurement | Italian | Hopi |
| Minimum | 34.7% | 27.6% |
| Maximum | 100.0% | 88.1% |
| Range | 65.3% | 60.5% |
| Mean | 67.3% | 50.2% |
| Median | 65.2% | 50.4% |
| Interquartile 25% (IQ1) | 63.7% | 40.4% |
| Interquartile 75% (IQ3) | 66.9% | 58.3% |
| Interquartile Range (IQR) | 3.2% | 17.9% |
| Standard Deviation (Sample) | 11.7% | 13.0% |
| Standard Deviation (Population) | 11.7% | 12.8% |
Similar Demographics by In Labor Force | Age > 16
Demographics Similar to Italians by In Labor Force | Age > 16
In terms of in labor force | age > 16, the demographic groups most similar to Italians are Vietnamese (64.6%, a difference of 0.0%), Austrian (64.6%, a difference of 0.0%), Immigrants from Norway (64.6%, a difference of 0.0%), Slavic (64.6%, a difference of 0.020%), and Lebanese (64.5%, a difference of 0.050%).
| Demographics | Rating | Rank | In Labor Force | Age > 16 |
| Chinese | 7.3 /100 | #230 | Tragic 64.7% |
| Immigrants | Northern Europe | 7.2 /100 | #231 | Tragic 64.7% |
| Africans | 5.8 /100 | #232 | Tragic 64.6% |
| Slavs | 4.9 /100 | #233 | Tragic 64.6% |
| Vietnamese | 4.7 /100 | #234 | Tragic 64.6% |
| Austrians | 4.6 /100 | #235 | Tragic 64.6% |
| Immigrants | Norway | 4.6 /100 | #236 | Tragic 64.6% |
| Italians | 4.6 /100 | #237 | Tragic 64.6% |
| Lebanese | 3.9 /100 | #238 | Tragic 64.5% |
| Immigrants | Hungary | 3.8 /100 | #239 | Tragic 64.5% |
| Immigrants | Bangladesh | 3.6 /100 | #240 | Tragic 64.5% |
| Immigrants | Dominica | 3.5 /100 | #241 | Tragic 64.5% |
| Immigrants | Netherlands | 3.4 /100 | #242 | Tragic 64.5% |
| Immigrants | Lebanon | 3.2 /100 | #243 | Tragic 64.5% |
| Tsimshian | 3.1 /100 | #244 | Tragic 64.5% |
Demographics Similar to Hopi by In Labor Force | Age > 16
In terms of in labor force | age > 16, the demographic groups most similar to Hopi are Puerto Rican (58.1%, a difference of 0.47%), Yuman (57.8%, a difference of 0.99%), Pueblo (59.3%, a difference of 1.5%), Pima (57.4%, a difference of 1.7%), and Houma (59.5%, a difference of 1.9%).
| Demographics | Rating | Rank | In Labor Force | Age > 16 |
| Paiute | 0.0 /100 | #333 | Tragic 60.7% |
| Apache | 0.0 /100 | #334 | Tragic 60.7% |
| Natives/Alaskans | 0.0 /100 | #335 | Tragic 60.6% |
| Menominee | 0.0 /100 | #336 | Tragic 60.6% |
| Colville | 0.0 /100 | #337 | Tragic 59.8% |
| Immigrants | Yemen | 0.0 /100 | #338 | Tragic 59.6% |
| Houma | 0.0 /100 | #339 | Tragic 59.5% |
| Pueblo | 0.0 /100 | #340 | Tragic 59.3% |
| Hopi | 0.0 /100 | #341 | Tragic 58.4% |
| Puerto Ricans | 0.0 /100 | #342 | Tragic 58.1% |
| Yuman | 0.0 /100 | #343 | Tragic 57.8% |
| Pima | 0.0 /100 | #344 | Tragic 57.4% |
| Tohono O'odham | 0.0 /100 | #345 | Tragic 57.2% |
| Lumbee | 0.0 /100 | #346 | Tragic 56.8% |
| Navajo | 0.0 /100 | #347 | Tragic 56.6% |