Immigrants from Northern Africa vs Hopi In Labor Force | Age > 16
COMPARE
Immigrants from Northern Africa
Hopi
In Labor Force | Age > 16
In Labor Force | Age > 16 Comparison
Immigrants from Northern Africa
Hopi
66.6%
IN LABOR FORCE | AGE > 16
100.0/ 100
METRIC RATING
49th/ 347
METRIC RANK
58.4%
IN LABOR FORCE | AGE > 16
0.0/ 100
METRIC RATING
341st/ 347
METRIC RANK
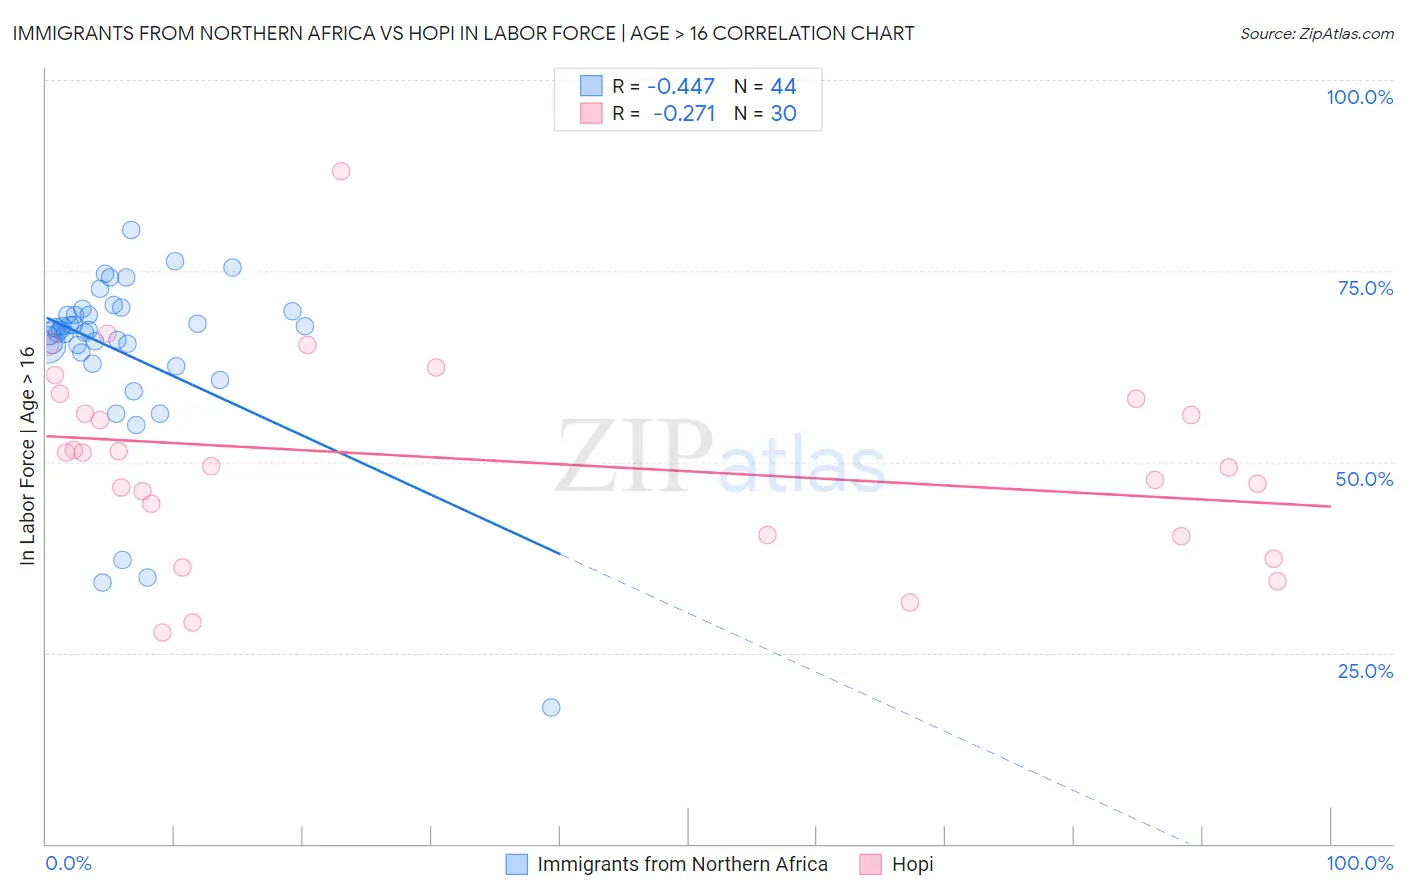
Immigrants from Northern Africa vs Hopi In Labor Force | Age > 16 Correlation Chart
The statistical analysis conducted on geographies consisting of 321,205,048 people shows a moderate negative correlation between the proportion of Immigrants from Northern Africa and labor force participation rate among population ages 16 and over in the United States with a correlation coefficient (R) of -0.447 and weighted average of 66.6%. Similarly, the statistical analysis conducted on geographies consisting of 74,733,532 people shows a weak negative correlation between the proportion of Hopi and labor force participation rate among population ages 16 and over in the United States with a correlation coefficient (R) of -0.271 and weighted average of 58.4%, a difference of 14.1%.
In Labor Force | Age > 16 Correlation Summary
| Measurement | Immigrants from Northern Africa | Hopi |
| Minimum | 17.9% | 27.6% |
| Maximum | 80.4% | 88.1% |
| Range | 62.5% | 60.5% |
| Mean | 64.1% | 50.2% |
| Median | 67.2% | 50.4% |
| Interquartile 25% (IQ1) | 63.6% | 40.4% |
| Interquartile 75% (IQ3) | 69.5% | 58.3% |
| Interquartile Range (IQR) | 5.8% | 17.9% |
| Standard Deviation (Sample) | 12.0% | 13.0% |
| Standard Deviation (Population) | 11.8% | 12.8% |
Similar Demographics by In Labor Force | Age > 16
Demographics Similar to Immigrants from Northern Africa by In Labor Force | Age > 16
In terms of in labor force | age > 16, the demographic groups most similar to Immigrants from Northern Africa are Nigerian (66.6%, a difference of 0.020%), Brazilian (66.6%, a difference of 0.030%), Immigrants from Bulgaria (66.6%, a difference of 0.030%), Cape Verdean (66.6%, a difference of 0.050%), and Immigrants from Brazil (66.7%, a difference of 0.10%).
| Demographics | Rating | Rank | In Labor Force | Age > 16 |
| Senegalese | 100.0 /100 | #42 | Exceptional 66.7% |
| Luxembourgers | 100.0 /100 | #43 | Exceptional 66.7% |
| Immigrants | Pakistan | 100.0 /100 | #44 | Exceptional 66.7% |
| Immigrants | Brazil | 100.0 /100 | #45 | Exceptional 66.7% |
| Brazilians | 100.0 /100 | #46 | Exceptional 66.6% |
| Immigrants | Bulgaria | 100.0 /100 | #47 | Exceptional 66.6% |
| Nigerians | 100.0 /100 | #48 | Exceptional 66.6% |
| Immigrants | Northern Africa | 100.0 /100 | #49 | Exceptional 66.6% |
| Cape Verdeans | 100.0 /100 | #50 | Exceptional 66.6% |
| Immigrants | Kuwait | 100.0 /100 | #51 | Exceptional 66.5% |
| Paraguayans | 99.9 /100 | #52 | Exceptional 66.5% |
| Immigrants | Sri Lanka | 99.9 /100 | #53 | Exceptional 66.5% |
| Immigrants | Bosnia and Herzegovina | 99.9 /100 | #54 | Exceptional 66.5% |
| Immigrants | Venezuela | 99.9 /100 | #55 | Exceptional 66.4% |
| Immigrants | Senegal | 99.9 /100 | #56 | Exceptional 66.4% |
Demographics Similar to Hopi by In Labor Force | Age > 16
In terms of in labor force | age > 16, the demographic groups most similar to Hopi are Puerto Rican (58.1%, a difference of 0.47%), Yuman (57.8%, a difference of 0.99%), Pueblo (59.3%, a difference of 1.5%), Pima (57.4%, a difference of 1.7%), and Houma (59.5%, a difference of 1.9%).
| Demographics | Rating | Rank | In Labor Force | Age > 16 |
| Paiute | 0.0 /100 | #333 | Tragic 60.7% |
| Apache | 0.0 /100 | #334 | Tragic 60.7% |
| Natives/Alaskans | 0.0 /100 | #335 | Tragic 60.6% |
| Menominee | 0.0 /100 | #336 | Tragic 60.6% |
| Colville | 0.0 /100 | #337 | Tragic 59.8% |
| Immigrants | Yemen | 0.0 /100 | #338 | Tragic 59.6% |
| Houma | 0.0 /100 | #339 | Tragic 59.5% |
| Pueblo | 0.0 /100 | #340 | Tragic 59.3% |
| Hopi | 0.0 /100 | #341 | Tragic 58.4% |
| Puerto Ricans | 0.0 /100 | #342 | Tragic 58.1% |
| Yuman | 0.0 /100 | #343 | Tragic 57.8% |
| Pima | 0.0 /100 | #344 | Tragic 57.4% |
| Tohono O'odham | 0.0 /100 | #345 | Tragic 57.2% |
| Lumbee | 0.0 /100 | #346 | Tragic 56.8% |
| Navajo | 0.0 /100 | #347 | Tragic 56.6% |