Immigrants from Honduras vs Hopi Householder Income Ages 45 - 64 years
COMPARE
Immigrants from Honduras
Hopi
Householder Income Ages 45 - 64 years
Householder Income Ages 45 - 64 years Comparison
Immigrants from Honduras
Hopi
$82,697
HOUSEHOLDER INCOME AGES 45 - 64 YEARS
0.0/ 100
METRIC RATING
314th/ 347
METRIC RANK
$75,562
HOUSEHOLDER INCOME AGES 45 - 64 YEARS
0.0/ 100
METRIC RATING
338th/ 347
METRIC RANK
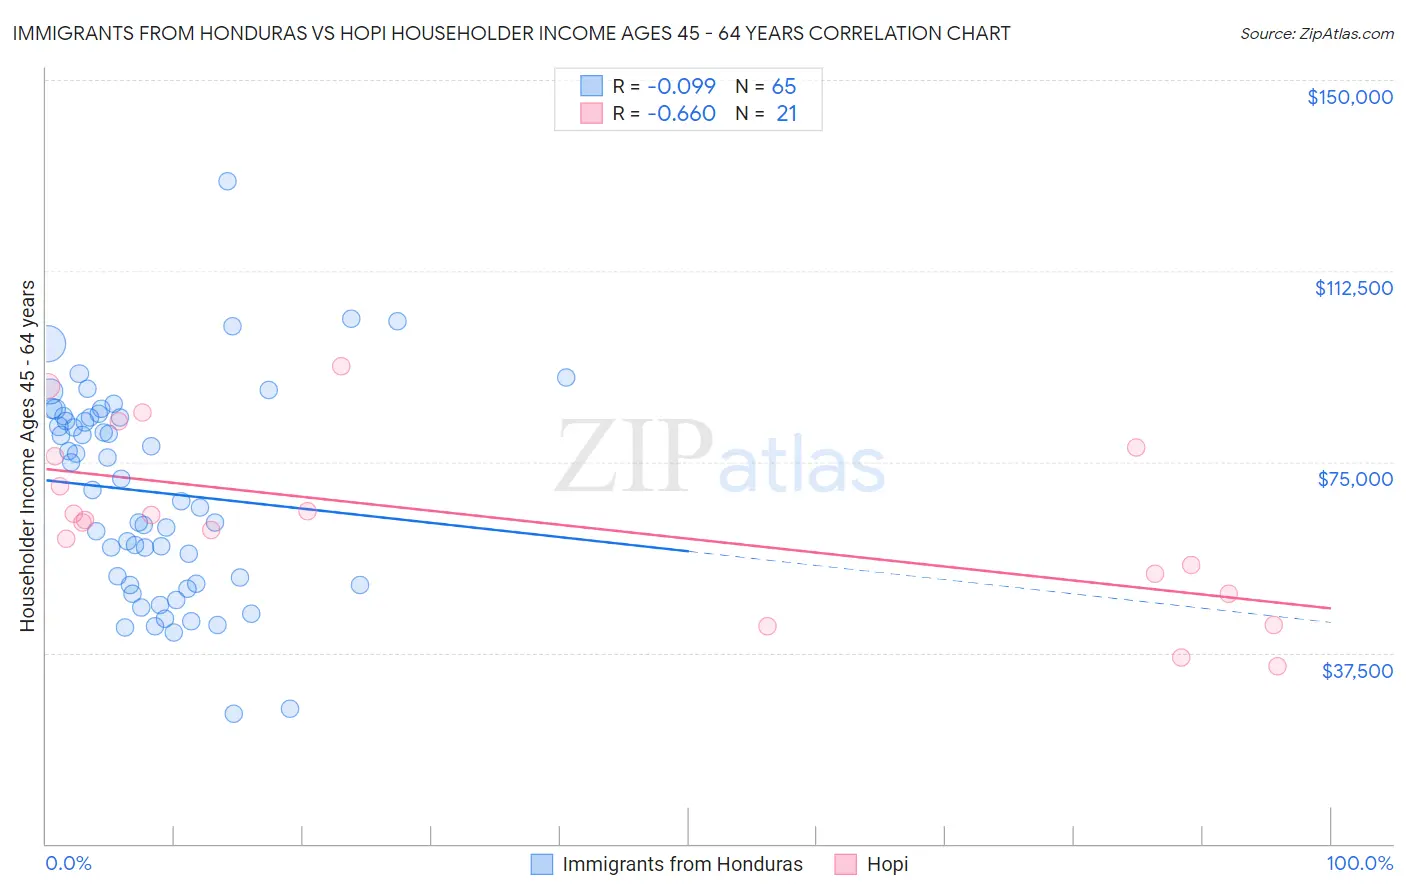
Immigrants from Honduras vs Hopi Householder Income Ages 45 - 64 years Correlation Chart
The statistical analysis conducted on geographies consisting of 322,186,782 people shows a slight negative correlation between the proportion of Immigrants from Honduras and household income with householder between the ages 45 and 64 in the United States with a correlation coefficient (R) of -0.099 and weighted average of $82,697. Similarly, the statistical analysis conducted on geographies consisting of 74,685,429 people shows a significant negative correlation between the proportion of Hopi and household income with householder between the ages 45 and 64 in the United States with a correlation coefficient (R) of -0.660 and weighted average of $75,562, a difference of 9.4%.
Householder Income Ages 45 - 64 years Correlation Summary
| Measurement | Immigrants from Honduras | Hopi |
| Minimum | $25,625 | $34,950 |
| Maximum | $130,200 | $93,766 |
| Range | $104,575 | $58,816 |
| Mean | $69,055 | $63,454 |
| Median | $69,386 | $63,663 |
| Interquartile 25% (IQ1) | $50,934 | $51,066 |
| Interquartile 75% (IQ3) | $83,889 | $76,979 |
| Interquartile Range (IQR) | $32,956 | $25,913 |
| Standard Deviation (Sample) | $20,449 | $16,805 |
| Standard Deviation (Population) | $20,291 | $16,400 |
Similar Demographics by Householder Income Ages 45 - 64 years
Demographics Similar to Immigrants from Honduras by Householder Income Ages 45 - 64 years
In terms of householder income ages 45 - 64 years, the demographic groups most similar to Immigrants from Honduras are U.S. Virgin Islander ($82,736, a difference of 0.050%), Paiute ($82,629, a difference of 0.080%), Immigrants from Caribbean ($82,513, a difference of 0.22%), Colville ($82,474, a difference of 0.27%), and Cajun ($83,015, a difference of 0.39%).
| Demographics | Rating | Rank | Householder Income Ages 45 - 64 years |
| Shoshone | 0.0 /100 | #307 | Tragic $83,588 |
| Immigrants | Cabo Verde | 0.0 /100 | #308 | Tragic $83,542 |
| Immigrants | Dominica | 0.0 /100 | #309 | Tragic $83,311 |
| Immigrants | Haiti | 0.0 /100 | #310 | Tragic $83,257 |
| Immigrants | Bahamas | 0.0 /100 | #311 | Tragic $83,177 |
| Cajuns | 0.0 /100 | #312 | Tragic $83,015 |
| U.S. Virgin Islanders | 0.0 /100 | #313 | Tragic $82,736 |
| Immigrants | Honduras | 0.0 /100 | #314 | Tragic $82,697 |
| Paiute | 0.0 /100 | #315 | Tragic $82,629 |
| Immigrants | Caribbean | 0.0 /100 | #316 | Tragic $82,513 |
| Colville | 0.0 /100 | #317 | Tragic $82,474 |
| Choctaw | 0.0 /100 | #318 | Tragic $82,287 |
| Chickasaw | 0.0 /100 | #319 | Tragic $82,193 |
| Apache | 0.0 /100 | #320 | Tragic $82,184 |
| Yuman | 0.0 /100 | #321 | Tragic $82,139 |
Demographics Similar to Hopi by Householder Income Ages 45 - 64 years
In terms of householder income ages 45 - 64 years, the demographic groups most similar to Hopi are Pueblo ($75,601, a difference of 0.050%), Arapaho ($75,945, a difference of 0.51%), Kiowa ($74,815, a difference of 1.0%), Cheyenne ($76,362, a difference of 1.1%), and Immigrants from Yemen ($74,575, a difference of 1.3%).
| Demographics | Rating | Rank | Householder Income Ages 45 - 64 years |
| Immigrants | Dominican Republic | 0.0 /100 | #331 | Tragic $78,836 |
| Blacks/African Americans | 0.0 /100 | #332 | Tragic $78,556 |
| Immigrants | Congo | 0.0 /100 | #333 | Tragic $77,850 |
| Menominee | 0.0 /100 | #334 | Tragic $76,903 |
| Cheyenne | 0.0 /100 | #335 | Tragic $76,362 |
| Arapaho | 0.0 /100 | #336 | Tragic $75,945 |
| Pueblo | 0.0 /100 | #337 | Tragic $75,601 |
| Hopi | 0.0 /100 | #338 | Tragic $75,562 |
| Kiowa | 0.0 /100 | #339 | Tragic $74,815 |
| Immigrants | Yemen | 0.0 /100 | #340 | Tragic $74,575 |
| Crow | 0.0 /100 | #341 | Tragic $74,257 |
| Tohono O'odham | 0.0 /100 | #342 | Tragic $73,774 |
| Pima | 0.0 /100 | #343 | Tragic $73,365 |
| Houma | 0.0 /100 | #344 | Tragic $72,093 |
| Navajo | 0.0 /100 | #345 | Tragic $69,759 |