Immigrants from Honduras vs Vietnamese In Labor Force | Age > 16
COMPARE
Immigrants from Honduras
Vietnamese
In Labor Force | Age > 16
In Labor Force | Age > 16 Comparison
Immigrants from Honduras
Vietnamese
65.8%
IN LABOR FORCE | AGE > 16
97.5/ 100
METRIC RATING
111th/ 347
METRIC RANK
64.6%
IN LABOR FORCE | AGE > 16
4.7/ 100
METRIC RATING
234th/ 347
METRIC RANK
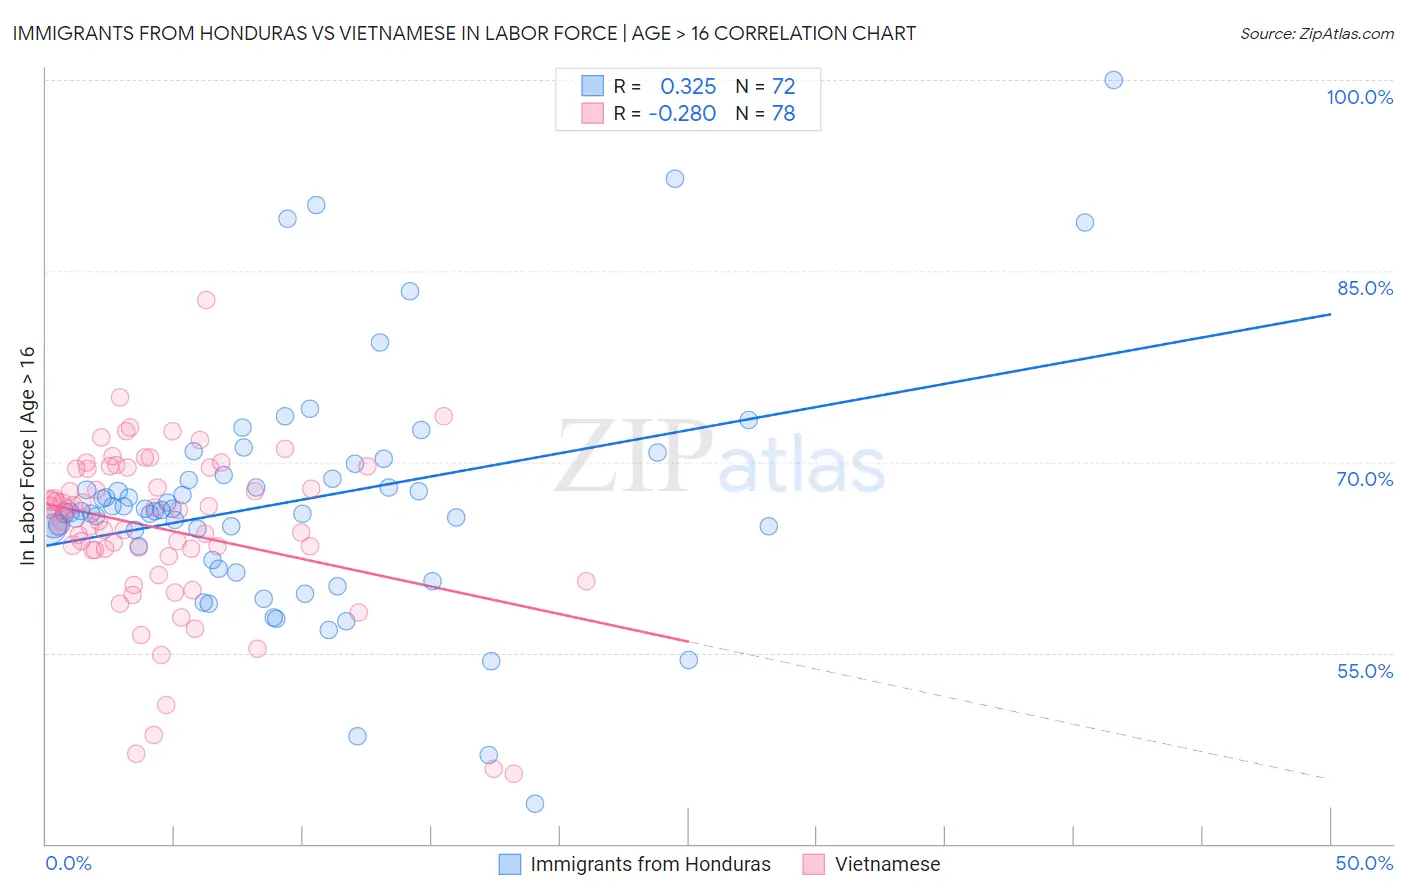
Immigrants from Honduras vs Vietnamese In Labor Force | Age > 16 Correlation Chart
The statistical analysis conducted on geographies consisting of 322,603,384 people shows a mild positive correlation between the proportion of Immigrants from Honduras and labor force participation rate among population ages 16 and over in the United States with a correlation coefficient (R) of 0.325 and weighted average of 65.8%. Similarly, the statistical analysis conducted on geographies consisting of 170,758,607 people shows a weak negative correlation between the proportion of Vietnamese and labor force participation rate among population ages 16 and over in the United States with a correlation coefficient (R) of -0.280 and weighted average of 64.6%, a difference of 1.9%.
In Labor Force | Age > 16 Correlation Summary
| Measurement | Immigrants from Honduras | Vietnamese |
| Minimum | 43.1% | 45.5% |
| Maximum | 100.0% | 82.7% |
| Range | 56.9% | 37.2% |
| Mean | 66.9% | 64.7% |
| Median | 66.1% | 65.8% |
| Interquartile 25% (IQ1) | 62.8% | 63.1% |
| Interquartile 75% (IQ3) | 68.8% | 69.5% |
| Interquartile Range (IQR) | 6.0% | 6.4% |
| Standard Deviation (Sample) | 9.5% | 6.6% |
| Standard Deviation (Population) | 9.4% | 6.5% |
Similar Demographics by In Labor Force | Age > 16
Demographics Similar to Immigrants from Honduras by In Labor Force | Age > 16
In terms of in labor force | age > 16, the demographic groups most similar to Immigrants from Honduras are Japanese (65.8%, a difference of 0.020%), Laotian (65.8%, a difference of 0.020%), Pakistani (65.8%, a difference of 0.040%), Honduran (65.8%, a difference of 0.050%), and Immigrants from Spain (65.8%, a difference of 0.060%).
| Demographics | Rating | Rank | In Labor Force | Age > 16 |
| Palestinians | 98.5 /100 | #104 | Exceptional 65.9% |
| Colombians | 98.4 /100 | #105 | Exceptional 65.9% |
| Immigrants | Serbia | 98.1 /100 | #106 | Exceptional 65.8% |
| Immigrants | Poland | 98.1 /100 | #107 | Exceptional 65.8% |
| Immigrants | Spain | 98.0 /100 | #108 | Exceptional 65.8% |
| Immigrants | Japan | 98.0 /100 | #109 | Exceptional 65.8% |
| Japanese | 97.7 /100 | #110 | Exceptional 65.8% |
| Immigrants | Honduras | 97.5 /100 | #111 | Exceptional 65.8% |
| Laotians | 97.4 /100 | #112 | Exceptional 65.8% |
| Pakistanis | 97.1 /100 | #113 | Exceptional 65.8% |
| Hondurans | 97.1 /100 | #114 | Exceptional 65.8% |
| Immigrants | Indonesia | 96.8 /100 | #115 | Exceptional 65.7% |
| Argentineans | 96.7 /100 | #116 | Exceptional 65.7% |
| Immigrants | Iran | 96.6 /100 | #117 | Exceptional 65.7% |
| Immigrants | Thailand | 96.6 /100 | #118 | Exceptional 65.7% |
Demographics Similar to Vietnamese by In Labor Force | Age > 16
In terms of in labor force | age > 16, the demographic groups most similar to Vietnamese are Austrian (64.6%, a difference of 0.0%), Immigrants from Norway (64.6%, a difference of 0.0%), Italian (64.6%, a difference of 0.0%), Slavic (64.6%, a difference of 0.010%), and Lebanese (64.5%, a difference of 0.050%).
| Demographics | Rating | Rank | In Labor Force | Age > 16 |
| Poles | 8.3 /100 | #227 | Tragic 64.7% |
| Northern Europeans | 8.2 /100 | #228 | Tragic 64.7% |
| British | 7.3 /100 | #229 | Tragic 64.7% |
| Chinese | 7.3 /100 | #230 | Tragic 64.7% |
| Immigrants | Northern Europe | 7.2 /100 | #231 | Tragic 64.7% |
| Africans | 5.8 /100 | #232 | Tragic 64.6% |
| Slavs | 4.9 /100 | #233 | Tragic 64.6% |
| Vietnamese | 4.7 /100 | #234 | Tragic 64.6% |
| Austrians | 4.6 /100 | #235 | Tragic 64.6% |
| Immigrants | Norway | 4.6 /100 | #236 | Tragic 64.6% |
| Italians | 4.6 /100 | #237 | Tragic 64.6% |
| Lebanese | 3.9 /100 | #238 | Tragic 64.5% |
| Immigrants | Hungary | 3.8 /100 | #239 | Tragic 64.5% |
| Immigrants | Bangladesh | 3.6 /100 | #240 | Tragic 64.5% |
| Immigrants | Dominica | 3.5 /100 | #241 | Tragic 64.5% |