Moroccan vs Hopi In Labor Force | Age > 16
COMPARE
Moroccan
Hopi
In Labor Force | Age > 16
In Labor Force | Age > 16 Comparison
Moroccans
Hopi
66.1%
IN LABOR FORCE | AGE > 16
99.5/ 100
METRIC RATING
81st/ 347
METRIC RANK
58.4%
IN LABOR FORCE | AGE > 16
0.0/ 100
METRIC RATING
341st/ 347
METRIC RANK
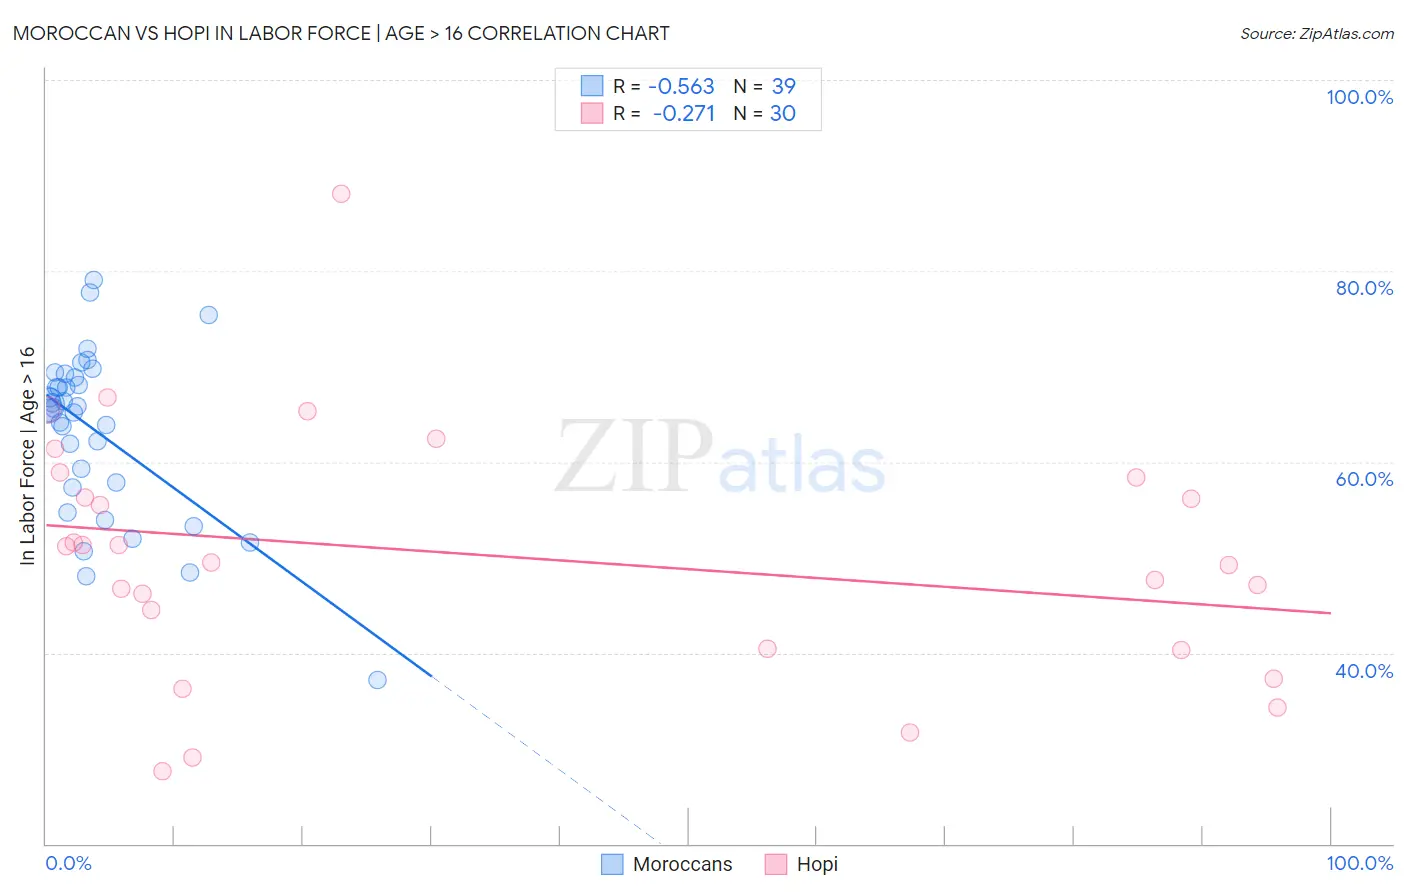
Moroccan vs Hopi In Labor Force | Age > 16 Correlation Chart
The statistical analysis conducted on geographies consisting of 201,807,372 people shows a substantial negative correlation between the proportion of Moroccans and labor force participation rate among population ages 16 and over in the United States with a correlation coefficient (R) of -0.563 and weighted average of 66.1%. Similarly, the statistical analysis conducted on geographies consisting of 74,733,532 people shows a weak negative correlation between the proportion of Hopi and labor force participation rate among population ages 16 and over in the United States with a correlation coefficient (R) of -0.271 and weighted average of 58.4%, a difference of 13.2%.
In Labor Force | Age > 16 Correlation Summary
| Measurement | Moroccan | Hopi |
| Minimum | 37.1% | 27.6% |
| Maximum | 79.1% | 88.1% |
| Range | 42.0% | 60.5% |
| Mean | 63.1% | 50.2% |
| Median | 65.7% | 50.4% |
| Interquartile 25% (IQ1) | 57.4% | 40.4% |
| Interquartile 75% (IQ3) | 68.9% | 58.3% |
| Interquartile Range (IQR) | 11.5% | 17.9% |
| Standard Deviation (Sample) | 8.9% | 13.0% |
| Standard Deviation (Population) | 8.7% | 12.8% |
Similar Demographics by In Labor Force | Age > 16
Demographics Similar to Moroccans by In Labor Force | Age > 16
In terms of in labor force | age > 16, the demographic groups most similar to Moroccans are German Russian (66.1%, a difference of 0.010%), Immigrants from Jordan (66.1%, a difference of 0.010%), Central American (66.1%, a difference of 0.020%), Mongolian (66.1%, a difference of 0.030%), and Malaysian (66.1%, a difference of 0.050%).
| Demographics | Rating | Rank | In Labor Force | Age > 16 |
| Immigrants | Korea | 99.7 /100 | #74 | Exceptional 66.2% |
| Immigrants | Singapore | 99.7 /100 | #75 | Exceptional 66.2% |
| Immigrants | Malaysia | 99.6 /100 | #76 | Exceptional 66.1% |
| Immigrants | Moldova | 99.6 /100 | #77 | Exceptional 66.1% |
| Immigrants | Asia | 99.6 /100 | #78 | Exceptional 66.1% |
| Turks | 99.6 /100 | #79 | Exceptional 66.1% |
| Malaysians | 99.6 /100 | #80 | Exceptional 66.1% |
| Moroccans | 99.5 /100 | #81 | Exceptional 66.1% |
| German Russians | 99.4 /100 | #82 | Exceptional 66.1% |
| Immigrants | Jordan | 99.4 /100 | #83 | Exceptional 66.1% |
| Central Americans | 99.4 /100 | #84 | Exceptional 66.1% |
| Mongolians | 99.4 /100 | #85 | Exceptional 66.1% |
| South Americans | 99.4 /100 | #86 | Exceptional 66.0% |
| South American Indians | 99.4 /100 | #87 | Exceptional 66.0% |
| Bermudans | 99.3 /100 | #88 | Exceptional 66.0% |
Demographics Similar to Hopi by In Labor Force | Age > 16
In terms of in labor force | age > 16, the demographic groups most similar to Hopi are Puerto Rican (58.1%, a difference of 0.47%), Yuman (57.8%, a difference of 0.99%), Pueblo (59.3%, a difference of 1.5%), Pima (57.4%, a difference of 1.7%), and Houma (59.5%, a difference of 1.9%).
| Demographics | Rating | Rank | In Labor Force | Age > 16 |
| Paiute | 0.0 /100 | #333 | Tragic 60.7% |
| Apache | 0.0 /100 | #334 | Tragic 60.7% |
| Natives/Alaskans | 0.0 /100 | #335 | Tragic 60.6% |
| Menominee | 0.0 /100 | #336 | Tragic 60.6% |
| Colville | 0.0 /100 | #337 | Tragic 59.8% |
| Immigrants | Yemen | 0.0 /100 | #338 | Tragic 59.6% |
| Houma | 0.0 /100 | #339 | Tragic 59.5% |
| Pueblo | 0.0 /100 | #340 | Tragic 59.3% |
| Hopi | 0.0 /100 | #341 | Tragic 58.4% |
| Puerto Ricans | 0.0 /100 | #342 | Tragic 58.1% |
| Yuman | 0.0 /100 | #343 | Tragic 57.8% |
| Pima | 0.0 /100 | #344 | Tragic 57.4% |
| Tohono O'odham | 0.0 /100 | #345 | Tragic 57.2% |
| Lumbee | 0.0 /100 | #346 | Tragic 56.8% |
| Navajo | 0.0 /100 | #347 | Tragic 56.6% |