Immigrants from Scotland vs Hopi In Labor Force | Age > 16
COMPARE
Immigrants from Scotland
Hopi
In Labor Force | Age > 16
In Labor Force | Age > 16 Comparison
Immigrants from Scotland
Hopi
64.2%
IN LABOR FORCE | AGE > 16
0.8/ 100
METRIC RATING
258th/ 347
METRIC RANK
58.4%
IN LABOR FORCE | AGE > 16
0.0/ 100
METRIC RATING
341st/ 347
METRIC RANK
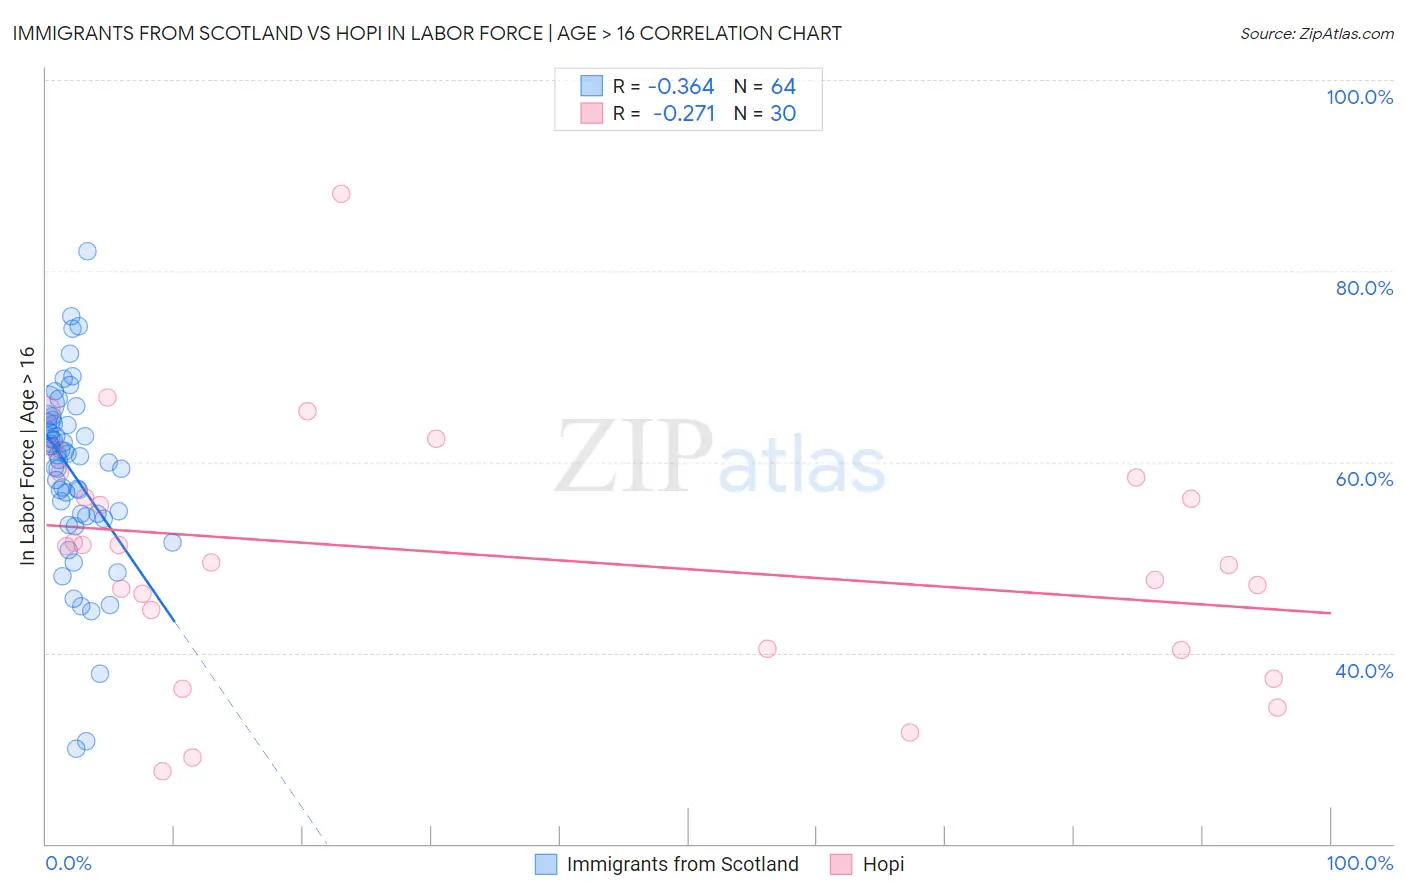
Immigrants from Scotland vs Hopi In Labor Force | Age > 16 Correlation Chart
The statistical analysis conducted on geographies consisting of 196,399,200 people shows a mild negative correlation between the proportion of Immigrants from Scotland and labor force participation rate among population ages 16 and over in the United States with a correlation coefficient (R) of -0.364 and weighted average of 64.2%. Similarly, the statistical analysis conducted on geographies consisting of 74,733,532 people shows a weak negative correlation between the proportion of Hopi and labor force participation rate among population ages 16 and over in the United States with a correlation coefficient (R) of -0.271 and weighted average of 58.4%, a difference of 10.0%.
In Labor Force | Age > 16 Correlation Summary
| Measurement | Immigrants from Scotland | Hopi |
| Minimum | 30.0% | 27.6% |
| Maximum | 82.1% | 88.1% |
| Range | 52.1% | 60.5% |
| Mean | 58.8% | 50.2% |
| Median | 60.7% | 50.4% |
| Interquartile 25% (IQ1) | 54.4% | 40.4% |
| Interquartile 75% (IQ3) | 64.0% | 58.3% |
| Interquartile Range (IQR) | 9.6% | 17.9% |
| Standard Deviation (Sample) | 9.5% | 13.0% |
| Standard Deviation (Population) | 9.5% | 12.8% |
Similar Demographics by In Labor Force | Age > 16
Demographics Similar to Immigrants from Scotland by In Labor Force | Age > 16
In terms of in labor force | age > 16, the demographic groups most similar to Immigrants from Scotland are Inupiat (64.3%, a difference of 0.020%), Immigrants from Western Europe (64.2%, a difference of 0.030%), Marshallese (64.2%, a difference of 0.040%), Basque (64.2%, a difference of 0.040%), and Finnish (64.2%, a difference of 0.050%).
| Demographics | Rating | Rank | In Labor Force | Age > 16 |
| Portuguese | 1.6 /100 | #251 | Tragic 64.4% |
| Immigrants | Dominican Republic | 1.5 /100 | #252 | Tragic 64.4% |
| Czechoslovakians | 1.4 /100 | #253 | Tragic 64.3% |
| Immigrants | Uzbekistan | 1.4 /100 | #254 | Tragic 64.3% |
| Hispanics or Latinos | 1.1 /100 | #255 | Tragic 64.3% |
| Immigrants | Mexico | 1.0 /100 | #256 | Tragic 64.3% |
| Inupiat | 0.8 /100 | #257 | Tragic 64.3% |
| Immigrants | Scotland | 0.8 /100 | #258 | Tragic 64.2% |
| Immigrants | Western Europe | 0.7 /100 | #259 | Tragic 64.2% |
| Marshallese | 0.7 /100 | #260 | Tragic 64.2% |
| Basques | 0.7 /100 | #261 | Tragic 64.2% |
| Finns | 0.7 /100 | #262 | Tragic 64.2% |
| Bahamians | 0.6 /100 | #263 | Tragic 64.2% |
| Dutch | 0.6 /100 | #264 | Tragic 64.2% |
| Cubans | 0.5 /100 | #265 | Tragic 64.2% |
Demographics Similar to Hopi by In Labor Force | Age > 16
In terms of in labor force | age > 16, the demographic groups most similar to Hopi are Puerto Rican (58.1%, a difference of 0.47%), Yuman (57.8%, a difference of 0.99%), Pueblo (59.3%, a difference of 1.5%), Pima (57.4%, a difference of 1.7%), and Houma (59.5%, a difference of 1.9%).
| Demographics | Rating | Rank | In Labor Force | Age > 16 |
| Paiute | 0.0 /100 | #333 | Tragic 60.7% |
| Apache | 0.0 /100 | #334 | Tragic 60.7% |
| Natives/Alaskans | 0.0 /100 | #335 | Tragic 60.6% |
| Menominee | 0.0 /100 | #336 | Tragic 60.6% |
| Colville | 0.0 /100 | #337 | Tragic 59.8% |
| Immigrants | Yemen | 0.0 /100 | #338 | Tragic 59.6% |
| Houma | 0.0 /100 | #339 | Tragic 59.5% |
| Pueblo | 0.0 /100 | #340 | Tragic 59.3% |
| Hopi | 0.0 /100 | #341 | Tragic 58.4% |
| Puerto Ricans | 0.0 /100 | #342 | Tragic 58.1% |
| Yuman | 0.0 /100 | #343 | Tragic 57.8% |
| Pima | 0.0 /100 | #344 | Tragic 57.4% |
| Tohono O'odham | 0.0 /100 | #345 | Tragic 57.2% |
| Lumbee | 0.0 /100 | #346 | Tragic 56.8% |
| Navajo | 0.0 /100 | #347 | Tragic 56.6% |