Immigrants from Lebanon vs Hopi In Labor Force | Age > 16
COMPARE
Immigrants from Lebanon
Hopi
In Labor Force | Age > 16
In Labor Force | Age > 16 Comparison
Immigrants from Lebanon
Hopi
64.5%
IN LABOR FORCE | AGE > 16
3.2/ 100
METRIC RATING
243rd/ 347
METRIC RANK
58.4%
IN LABOR FORCE | AGE > 16
0.0/ 100
METRIC RATING
341st/ 347
METRIC RANK
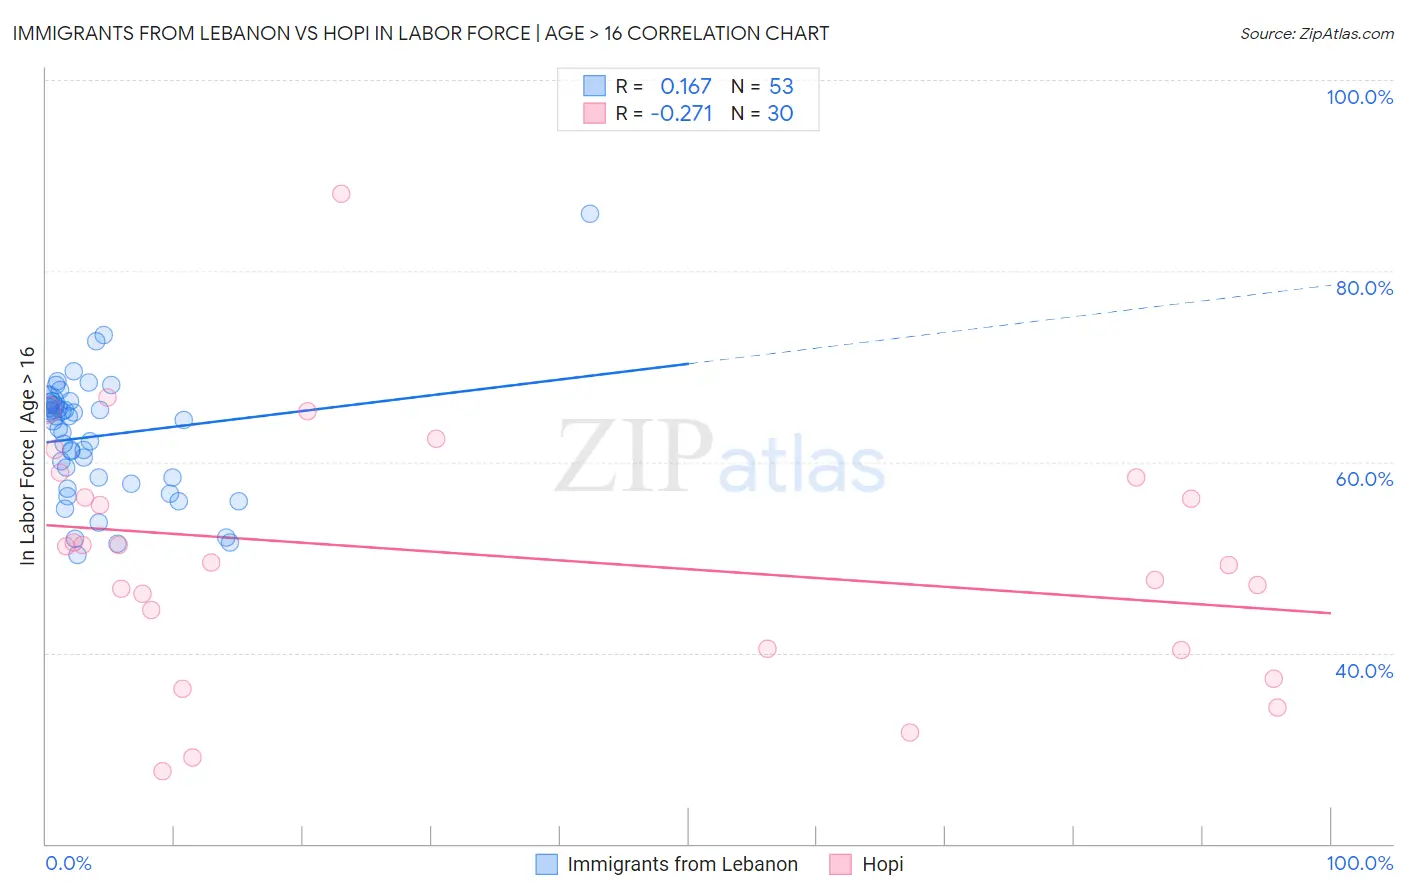
Immigrants from Lebanon vs Hopi In Labor Force | Age > 16 Correlation Chart
The statistical analysis conducted on geographies consisting of 217,155,604 people shows a poor positive correlation between the proportion of Immigrants from Lebanon and labor force participation rate among population ages 16 and over in the United States with a correlation coefficient (R) of 0.167 and weighted average of 64.5%. Similarly, the statistical analysis conducted on geographies consisting of 74,733,532 people shows a weak negative correlation between the proportion of Hopi and labor force participation rate among population ages 16 and over in the United States with a correlation coefficient (R) of -0.271 and weighted average of 58.4%, a difference of 10.5%.
In Labor Force | Age > 16 Correlation Summary
| Measurement | Immigrants from Lebanon | Hopi |
| Minimum | 50.2% | 27.6% |
| Maximum | 86.0% | 88.1% |
| Range | 35.8% | 60.5% |
| Mean | 62.7% | 50.2% |
| Median | 64.4% | 50.4% |
| Interquartile 25% (IQ1) | 58.1% | 40.4% |
| Interquartile 75% (IQ3) | 66.1% | 58.3% |
| Interquartile Range (IQR) | 8.0% | 17.9% |
| Standard Deviation (Sample) | 6.5% | 13.0% |
| Standard Deviation (Population) | 6.4% | 12.8% |
Similar Demographics by In Labor Force | Age > 16
Demographics Similar to Immigrants from Lebanon by In Labor Force | Age > 16
In terms of in labor force | age > 16, the demographic groups most similar to Immigrants from Lebanon are Immigrants from Netherlands (64.5%, a difference of 0.010%), Tsimshian (64.5%, a difference of 0.020%), West Indian (64.5%, a difference of 0.020%), Immigrants from Bangladesh (64.5%, a difference of 0.030%), and Immigrants from Dominica (64.5%, a difference of 0.030%).
| Demographics | Rating | Rank | In Labor Force | Age > 16 |
| Immigrants | Norway | 4.6 /100 | #236 | Tragic 64.6% |
| Italians | 4.6 /100 | #237 | Tragic 64.6% |
| Lebanese | 3.9 /100 | #238 | Tragic 64.5% |
| Immigrants | Hungary | 3.8 /100 | #239 | Tragic 64.5% |
| Immigrants | Bangladesh | 3.6 /100 | #240 | Tragic 64.5% |
| Immigrants | Dominica | 3.5 /100 | #241 | Tragic 64.5% |
| Immigrants | Netherlands | 3.4 /100 | #242 | Tragic 64.5% |
| Immigrants | Lebanon | 3.2 /100 | #243 | Tragic 64.5% |
| Tsimshian | 3.1 /100 | #244 | Tragic 64.5% |
| West Indians | 3.0 /100 | #245 | Tragic 64.5% |
| Immigrants | Caribbean | 2.3 /100 | #246 | Tragic 64.4% |
| Swiss | 2.1 /100 | #247 | Tragic 64.4% |
| Immigrants | Barbados | 2.1 /100 | #248 | Tragic 64.4% |
| Germans | 1.8 /100 | #249 | Tragic 64.4% |
| British West Indians | 1.8 /100 | #250 | Tragic 64.4% |
Demographics Similar to Hopi by In Labor Force | Age > 16
In terms of in labor force | age > 16, the demographic groups most similar to Hopi are Puerto Rican (58.1%, a difference of 0.47%), Yuman (57.8%, a difference of 0.99%), Pueblo (59.3%, a difference of 1.5%), Pima (57.4%, a difference of 1.7%), and Houma (59.5%, a difference of 1.9%).
| Demographics | Rating | Rank | In Labor Force | Age > 16 |
| Paiute | 0.0 /100 | #333 | Tragic 60.7% |
| Apache | 0.0 /100 | #334 | Tragic 60.7% |
| Natives/Alaskans | 0.0 /100 | #335 | Tragic 60.6% |
| Menominee | 0.0 /100 | #336 | Tragic 60.6% |
| Colville | 0.0 /100 | #337 | Tragic 59.8% |
| Immigrants | Yemen | 0.0 /100 | #338 | Tragic 59.6% |
| Houma | 0.0 /100 | #339 | Tragic 59.5% |
| Pueblo | 0.0 /100 | #340 | Tragic 59.3% |
| Hopi | 0.0 /100 | #341 | Tragic 58.4% |
| Puerto Ricans | 0.0 /100 | #342 | Tragic 58.1% |
| Yuman | 0.0 /100 | #343 | Tragic 57.8% |
| Pima | 0.0 /100 | #344 | Tragic 57.4% |
| Tohono O'odham | 0.0 /100 | #345 | Tragic 57.2% |
| Lumbee | 0.0 /100 | #346 | Tragic 56.8% |
| Navajo | 0.0 /100 | #347 | Tragic 56.6% |