Immigrants from Guatemala vs Immigrants from Zimbabwe In Labor Force | Age 25-29
COMPARE
Immigrants from Guatemala
Immigrants from Zimbabwe
In Labor Force | Age 25-29
In Labor Force | Age 25-29 Comparison
Immigrants from Guatemala
Immigrants from Zimbabwe
83.6%
IN LABOR FORCE | AGE 25-29
0.1/ 100
METRIC RATING
258th/ 347
METRIC RANK
85.2%
IN LABOR FORCE | AGE 25-29
97.6/ 100
METRIC RATING
80th/ 347
METRIC RANK
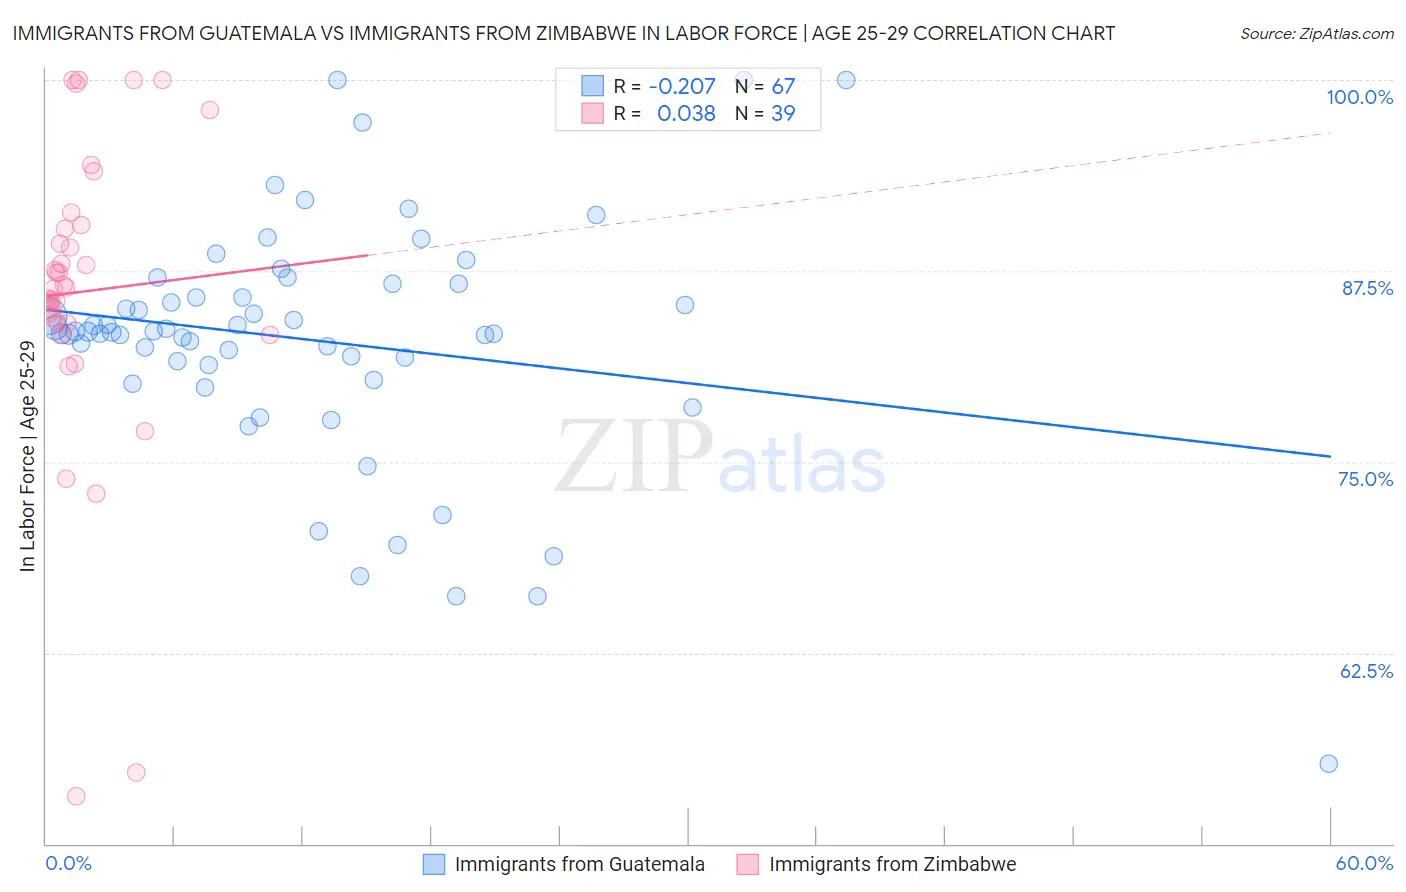
Immigrants from Guatemala vs Immigrants from Zimbabwe In Labor Force | Age 25-29 Correlation Chart
The statistical analysis conducted on geographies consisting of 377,188,709 people shows a weak negative correlation between the proportion of Immigrants from Guatemala and labor force participation rate among population between the ages 25 and 29 in the United States with a correlation coefficient (R) of -0.207 and weighted average of 83.6%. Similarly, the statistical analysis conducted on geographies consisting of 117,801,393 people shows no correlation between the proportion of Immigrants from Zimbabwe and labor force participation rate among population between the ages 25 and 29 in the United States with a correlation coefficient (R) of 0.038 and weighted average of 85.2%, a difference of 1.9%.
In Labor Force | Age 25-29 Correlation Summary
| Measurement | Immigrants from Guatemala | Immigrants from Zimbabwe |
| Minimum | 55.2% | 53.1% |
| Maximum | 100.0% | 100.0% |
| Range | 44.8% | 46.9% |
| Mean | 83.0% | 86.2% |
| Median | 83.5% | 86.4% |
| Interquartile 25% (IQ1) | 81.4% | 84.0% |
| Interquartile 75% (IQ3) | 86.6% | 90.5% |
| Interquartile Range (IQR) | 5.3% | 6.5% |
| Standard Deviation (Sample) | 7.9% | 10.1% |
| Standard Deviation (Population) | 7.8% | 10.0% |
Similar Demographics by In Labor Force | Age 25-29
Demographics Similar to Immigrants from Guatemala by In Labor Force | Age 25-29
In terms of in labor force | age 25-29, the demographic groups most similar to Immigrants from Guatemala are Spanish (83.6%, a difference of 0.010%), Immigrants from Bahamas (83.6%, a difference of 0.020%), Pennsylvania German (83.6%, a difference of 0.020%), Delaware (83.7%, a difference of 0.040%), and Immigrants from Haiti (83.7%, a difference of 0.050%).
| Demographics | Rating | Rank | In Labor Force | Age 25-29 |
| Bahamians | 0.2 /100 | #251 | Tragic 83.7% |
| Guatemalans | 0.2 /100 | #252 | Tragic 83.7% |
| Immigrants | Trinidad and Tobago | 0.2 /100 | #253 | Tragic 83.7% |
| Spaniards | 0.2 /100 | #254 | Tragic 83.7% |
| Haitians | 0.2 /100 | #255 | Tragic 83.7% |
| Immigrants | Haiti | 0.2 /100 | #256 | Tragic 83.7% |
| Delaware | 0.2 /100 | #257 | Tragic 83.7% |
| Immigrants | Guatemala | 0.1 /100 | #258 | Tragic 83.6% |
| Spanish | 0.1 /100 | #259 | Tragic 83.6% |
| Immigrants | Bahamas | 0.1 /100 | #260 | Tragic 83.6% |
| Pennsylvania Germans | 0.1 /100 | #261 | Tragic 83.6% |
| Immigrants | Fiji | 0.1 /100 | #262 | Tragic 83.6% |
| West Indians | 0.1 /100 | #263 | Tragic 83.5% |
| Puget Sound Salish | 0.1 /100 | #264 | Tragic 83.5% |
| Cubans | 0.1 /100 | #265 | Tragic 83.5% |
Demographics Similar to Immigrants from Zimbabwe by In Labor Force | Age 25-29
In terms of in labor force | age 25-29, the demographic groups most similar to Immigrants from Zimbabwe are Immigrants from Northern Africa (85.2%, a difference of 0.0%), Immigrants from Egypt (85.2%, a difference of 0.010%), Immigrants from Northern Europe (85.2%, a difference of 0.020%), Immigrants from South Central Asia (85.2%, a difference of 0.030%), and German (85.3%, a difference of 0.040%).
| Demographics | Rating | Rank | In Labor Force | Age 25-29 |
| Russians | 98.8 /100 | #73 | Exceptional 85.3% |
| Soviet Union | 98.5 /100 | #74 | Exceptional 85.3% |
| Brazilians | 98.3 /100 | #75 | Exceptional 85.3% |
| Germans | 98.1 /100 | #76 | Exceptional 85.3% |
| Immigrants | South Central Asia | 97.9 /100 | #77 | Exceptional 85.2% |
| Immigrants | Egypt | 97.7 /100 | #78 | Exceptional 85.2% |
| Immigrants | Northern Africa | 97.6 /100 | #79 | Exceptional 85.2% |
| Immigrants | Zimbabwe | 97.6 /100 | #80 | Exceptional 85.2% |
| Immigrants | Northern Europe | 97.2 /100 | #81 | Exceptional 85.2% |
| Okinawans | 97.0 /100 | #82 | Exceptional 85.2% |
| Immigrants | Europe | 96.8 /100 | #83 | Exceptional 85.2% |
| Immigrants | Eastern Europe | 96.8 /100 | #84 | Exceptional 85.2% |
| Immigrants | Africa | 96.7 /100 | #85 | Exceptional 85.2% |
| Ukrainians | 96.7 /100 | #86 | Exceptional 85.2% |
| French Canadians | 96.5 /100 | #87 | Exceptional 85.2% |