Immigrants from Guatemala vs Immigrants from England In Labor Force | Age 25-29
COMPARE
Immigrants from Guatemala
Immigrants from England
In Labor Force | Age 25-29
In Labor Force | Age 25-29 Comparison
Immigrants from Guatemala
Immigrants from England
83.6%
IN LABOR FORCE | AGE 25-29
0.1/ 100
METRIC RATING
258th/ 347
METRIC RANK
84.7%
IN LABOR FORCE | AGE 25-29
65.2/ 100
METRIC RATING
148th/ 347
METRIC RANK
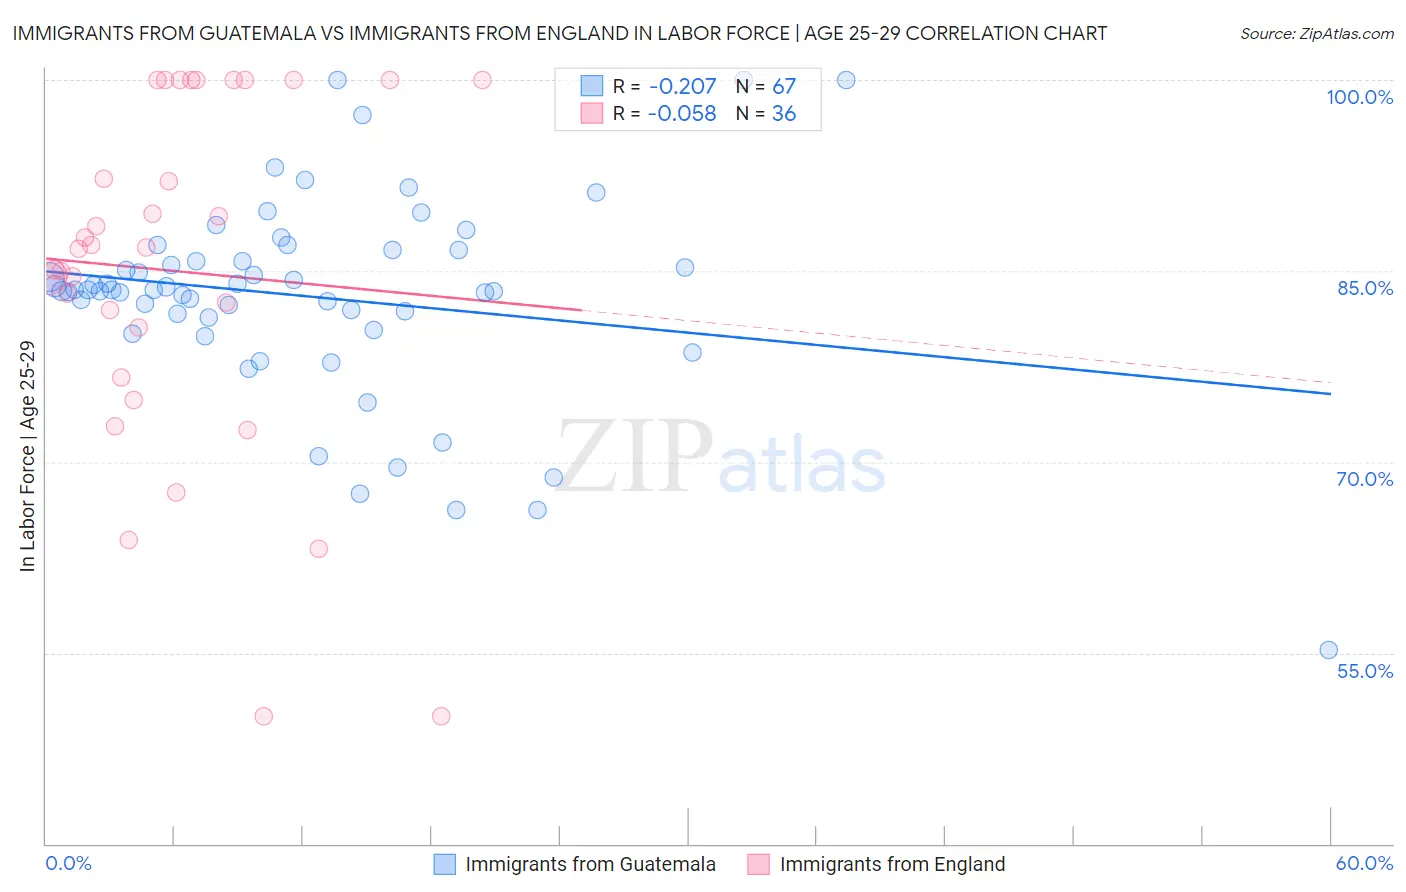
Immigrants from Guatemala vs Immigrants from England In Labor Force | Age 25-29 Correlation Chart
The statistical analysis conducted on geographies consisting of 377,188,709 people shows a weak negative correlation between the proportion of Immigrants from Guatemala and labor force participation rate among population between the ages 25 and 29 in the United States with a correlation coefficient (R) of -0.207 and weighted average of 83.6%. Similarly, the statistical analysis conducted on geographies consisting of 391,692,823 people shows a slight negative correlation between the proportion of Immigrants from England and labor force participation rate among population between the ages 25 and 29 in the United States with a correlation coefficient (R) of -0.058 and weighted average of 84.7%, a difference of 1.3%.
In Labor Force | Age 25-29 Correlation Summary
| Measurement | Immigrants from Guatemala | Immigrants from England |
| Minimum | 55.2% | 50.0% |
| Maximum | 100.0% | 100.0% |
| Range | 44.8% | 50.0% |
| Mean | 83.0% | 85.0% |
| Median | 83.5% | 86.8% |
| Interquartile 25% (IQ1) | 81.4% | 78.6% |
| Interquartile 75% (IQ3) | 86.6% | 100.0% |
| Interquartile Range (IQR) | 5.3% | 21.4% |
| Standard Deviation (Sample) | 7.9% | 13.7% |
| Standard Deviation (Population) | 7.8% | 13.6% |
Similar Demographics by In Labor Force | Age 25-29
Demographics Similar to Immigrants from Guatemala by In Labor Force | Age 25-29
In terms of in labor force | age 25-29, the demographic groups most similar to Immigrants from Guatemala are Spanish (83.6%, a difference of 0.010%), Immigrants from Bahamas (83.6%, a difference of 0.020%), Pennsylvania German (83.6%, a difference of 0.020%), Delaware (83.7%, a difference of 0.040%), and Immigrants from Haiti (83.7%, a difference of 0.050%).
| Demographics | Rating | Rank | In Labor Force | Age 25-29 |
| Bahamians | 0.2 /100 | #251 | Tragic 83.7% |
| Guatemalans | 0.2 /100 | #252 | Tragic 83.7% |
| Immigrants | Trinidad and Tobago | 0.2 /100 | #253 | Tragic 83.7% |
| Spaniards | 0.2 /100 | #254 | Tragic 83.7% |
| Haitians | 0.2 /100 | #255 | Tragic 83.7% |
| Immigrants | Haiti | 0.2 /100 | #256 | Tragic 83.7% |
| Delaware | 0.2 /100 | #257 | Tragic 83.7% |
| Immigrants | Guatemala | 0.1 /100 | #258 | Tragic 83.6% |
| Spanish | 0.1 /100 | #259 | Tragic 83.6% |
| Immigrants | Bahamas | 0.1 /100 | #260 | Tragic 83.6% |
| Pennsylvania Germans | 0.1 /100 | #261 | Tragic 83.6% |
| Immigrants | Fiji | 0.1 /100 | #262 | Tragic 83.6% |
| West Indians | 0.1 /100 | #263 | Tragic 83.5% |
| Puget Sound Salish | 0.1 /100 | #264 | Tragic 83.5% |
| Cubans | 0.1 /100 | #265 | Tragic 83.5% |
Demographics Similar to Immigrants from England by In Labor Force | Age 25-29
In terms of in labor force | age 25-29, the demographic groups most similar to Immigrants from England are Peruvian (84.7%, a difference of 0.0%), Swiss (84.7%, a difference of 0.0%), Immigrants from Asia (84.8%, a difference of 0.020%), Colombian (84.7%, a difference of 0.020%), and Immigrants from Pakistan (84.7%, a difference of 0.020%).
| Demographics | Rating | Rank | In Labor Force | Age 25-29 |
| Danes | 71.9 /100 | #141 | Good 84.8% |
| Pakistanis | 70.0 /100 | #142 | Good 84.8% |
| Sri Lankans | 69.2 /100 | #143 | Good 84.8% |
| Immigrants | Laos | 69.0 /100 | #144 | Good 84.8% |
| Immigrants | Senegal | 68.3 /100 | #145 | Good 84.8% |
| Icelanders | 68.2 /100 | #146 | Good 84.8% |
| Immigrants | Asia | 68.2 /100 | #147 | Good 84.8% |
| Immigrants | England | 65.2 /100 | #148 | Good 84.7% |
| Peruvians | 64.7 /100 | #149 | Good 84.7% |
| Swiss | 64.7 /100 | #150 | Good 84.7% |
| Colombians | 62.8 /100 | #151 | Good 84.7% |
| Immigrants | Pakistan | 62.7 /100 | #152 | Good 84.7% |
| Immigrants | Taiwan | 62.2 /100 | #153 | Good 84.7% |
| Immigrants | Sri Lanka | 61.7 /100 | #154 | Good 84.7% |
| Indians (Asian) | 61.6 /100 | #155 | Good 84.7% |