Immigrants from Eritrea vs Immigrants from Uganda In Labor Force | Age 35-44
COMPARE
Immigrants from Eritrea
Immigrants from Uganda
In Labor Force | Age 35-44
In Labor Force | Age 35-44 Comparison
Immigrants from Eritrea
Immigrants from Uganda
85.2%
IN LABOR FORCE | AGE 35-44
99.7/ 100
METRIC RATING
48th/ 347
METRIC RANK
85.0%
IN LABOR FORCE | AGE 35-44
99.3/ 100
METRIC RATING
63rd/ 347
METRIC RANK
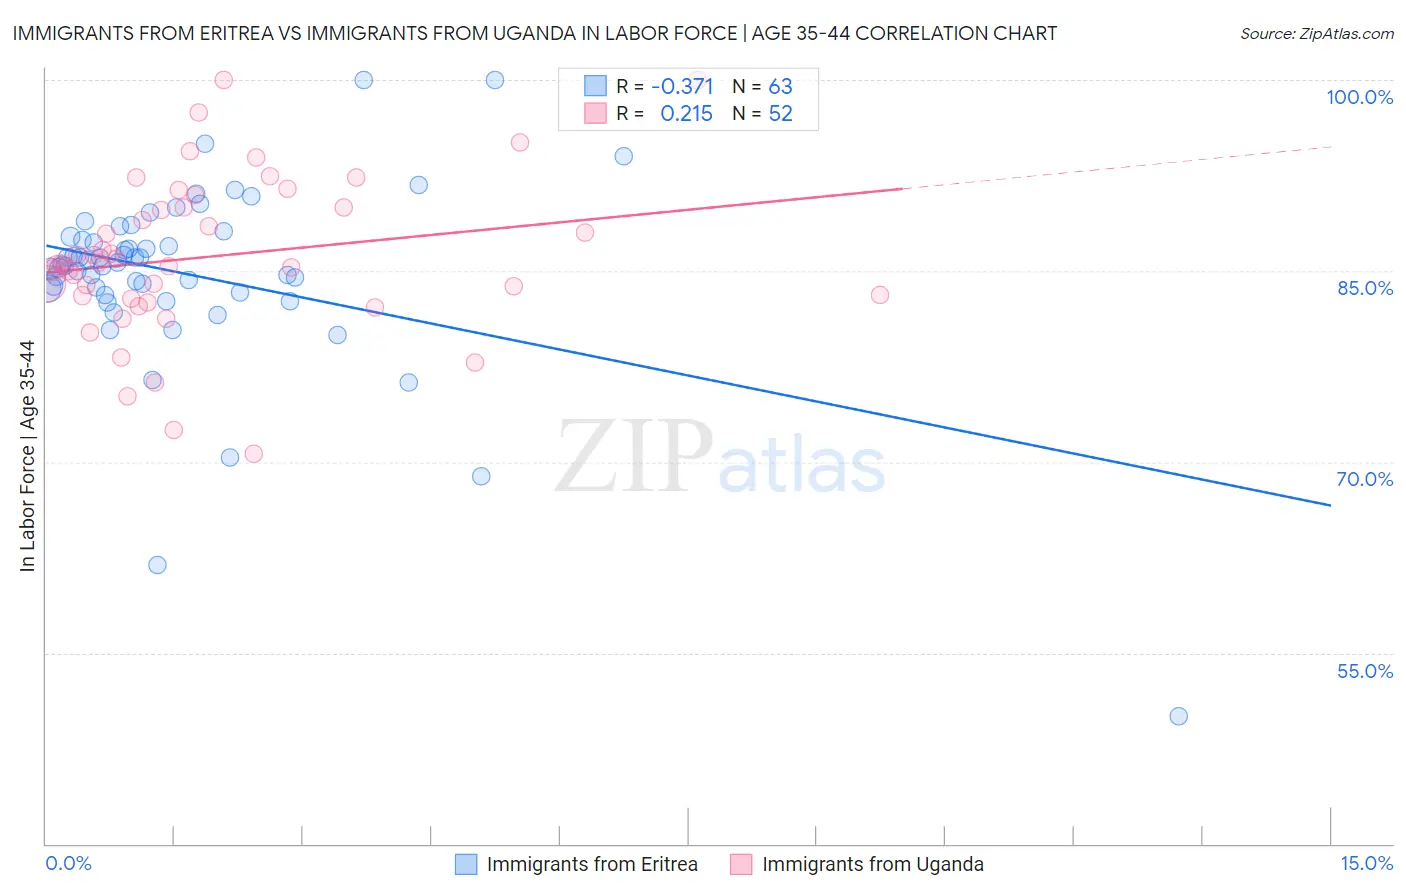
Immigrants from Eritrea vs Immigrants from Uganda In Labor Force | Age 35-44 Correlation Chart
The statistical analysis conducted on geographies consisting of 104,844,448 people shows a mild negative correlation between the proportion of Immigrants from Eritrea and labor force participation rate among population between the ages 35 and 44 in the United States with a correlation coefficient (R) of -0.371 and weighted average of 85.2%. Similarly, the statistical analysis conducted on geographies consisting of 125,971,479 people shows a weak positive correlation between the proportion of Immigrants from Uganda and labor force participation rate among population between the ages 35 and 44 in the United States with a correlation coefficient (R) of 0.215 and weighted average of 85.0%, a difference of 0.16%.
In Labor Force | Age 35-44 Correlation Summary
| Measurement | Immigrants from Eritrea | Immigrants from Uganda |
| Minimum | 50.0% | 70.6% |
| Maximum | 100.0% | 100.0% |
| Range | 50.0% | 29.4% |
| Mean | 84.7% | 86.1% |
| Median | 85.5% | 85.5% |
| Interquartile 25% (IQ1) | 83.3% | 82.9% |
| Interquartile 75% (IQ3) | 87.7% | 90.0% |
| Interquartile Range (IQR) | 4.4% | 7.0% |
| Standard Deviation (Sample) | 7.5% | 6.2% |
| Standard Deviation (Population) | 7.4% | 6.1% |
Demographics Similar to Immigrants from Eritrea and Immigrants from Uganda by In Labor Force | Age 35-44
In terms of in labor force | age 35-44, the demographic groups most similar to Immigrants from Eritrea are Croatian (85.2%, a difference of 0.0%), German Russian (85.2%, a difference of 0.010%), Cypriot (85.2%, a difference of 0.020%), Immigrants from Hong Kong (85.2%, a difference of 0.020%), and Thai (85.2%, a difference of 0.030%). Similarly, the demographic groups most similar to Immigrants from Uganda are Immigrants from Moldova (85.0%, a difference of 0.0%), Immigrants from Latvia (85.0%, a difference of 0.010%), Swedish (85.0%, a difference of 0.010%), Immigrants from Brazil (85.0%, a difference of 0.020%), and Slovak (85.1%, a difference of 0.030%).
| Demographics | Rating | Rank | In Labor Force | Age 35-44 |
| Cypriots | 99.8 /100 | #45 | Exceptional 85.2% |
| Immigrants | Hong Kong | 99.8 /100 | #46 | Exceptional 85.2% |
| German Russians | 99.8 /100 | #47 | Exceptional 85.2% |
| Immigrants | Eritrea | 99.7 /100 | #48 | Exceptional 85.2% |
| Croatians | 99.7 /100 | #49 | Exceptional 85.2% |
| Thais | 99.7 /100 | #50 | Exceptional 85.2% |
| Immigrants | Albania | 99.7 /100 | #51 | Exceptional 85.1% |
| Immigrants | Kenya | 99.6 /100 | #52 | Exceptional 85.1% |
| Taiwanese | 99.6 /100 | #53 | Exceptional 85.1% |
| Turks | 99.5 /100 | #54 | Exceptional 85.1% |
| Soviet Union | 99.5 /100 | #55 | Exceptional 85.1% |
| Immigrants | Croatia | 99.5 /100 | #56 | Exceptional 85.1% |
| Chinese | 99.4 /100 | #57 | Exceptional 85.1% |
| Slovaks | 99.4 /100 | #58 | Exceptional 85.1% |
| Serbians | 99.4 /100 | #59 | Exceptional 85.1% |
| Albanians | 99.4 /100 | #60 | Exceptional 85.1% |
| Immigrants | Latvia | 99.3 /100 | #61 | Exceptional 85.0% |
| Immigrants | Moldova | 99.3 /100 | #62 | Exceptional 85.0% |
| Immigrants | Uganda | 99.3 /100 | #63 | Exceptional 85.0% |
| Swedes | 99.2 /100 | #64 | Exceptional 85.0% |
| Immigrants | Brazil | 99.2 /100 | #65 | Exceptional 85.0% |