Immigrants from England vs Yakama In Labor Force | Age 16-19
COMPARE
Immigrants from England
Yakama
In Labor Force | Age 16-19
In Labor Force | Age 16-19 Comparison
Immigrants from England
Yakama
38.1%
IN LABOR FORCE | AGE 16-19
96.4/ 100
METRIC RATING
124th/ 347
METRIC RANK
36.9%
IN LABOR FORCE | AGE 16-19
66.9/ 100
METRIC RATING
165th/ 347
METRIC RANK
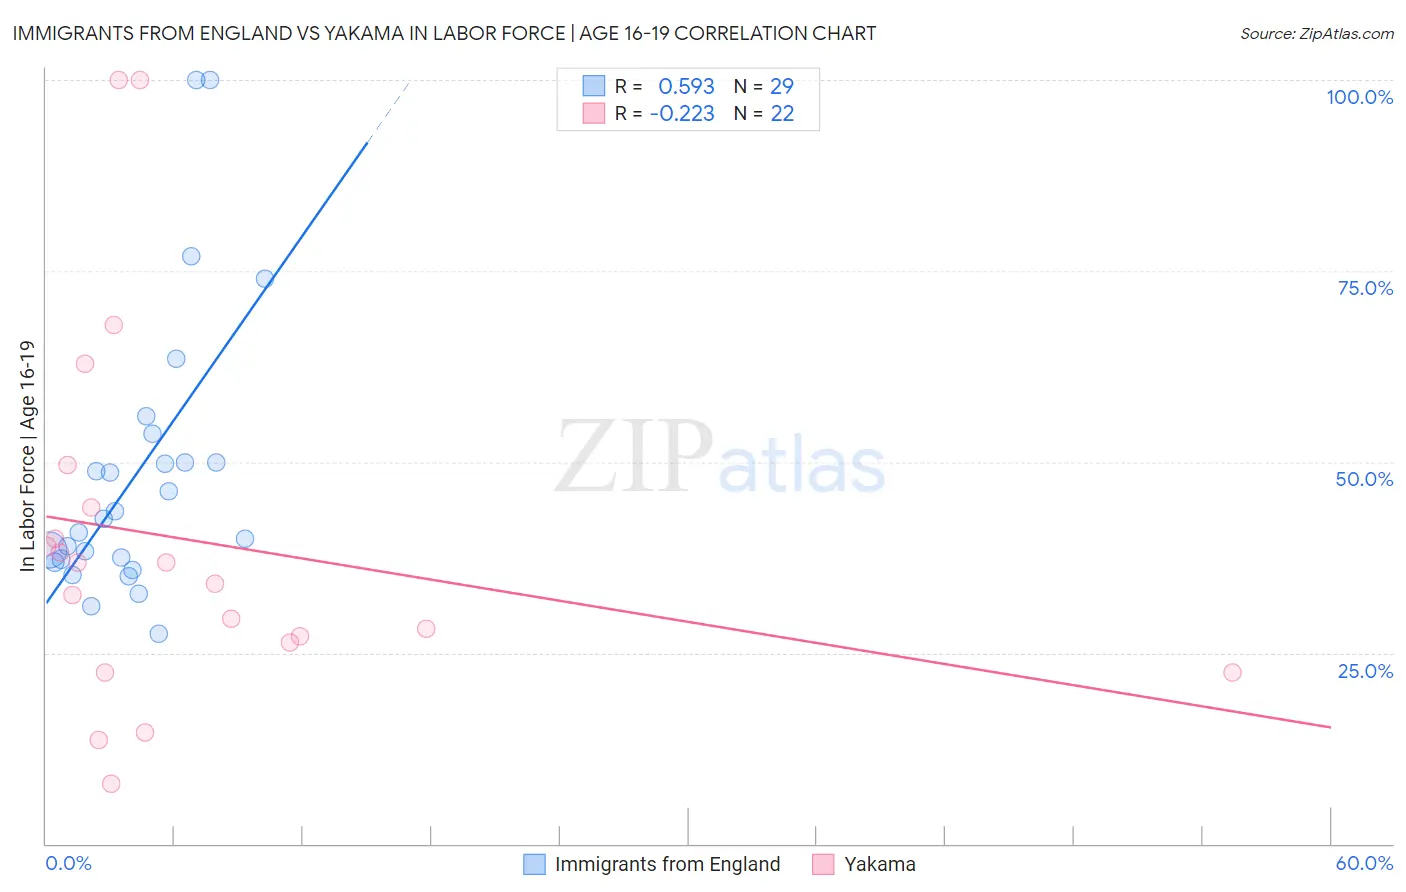
Immigrants from England vs Yakama In Labor Force | Age 16-19 Correlation Chart
The statistical analysis conducted on geographies consisting of 391,103,684 people shows a substantial positive correlation between the proportion of Immigrants from England and labor force participation rate among population between the ages 16 and 19 in the United States with a correlation coefficient (R) of 0.593 and weighted average of 38.1%. Similarly, the statistical analysis conducted on geographies consisting of 19,894,194 people shows a weak negative correlation between the proportion of Yakama and labor force participation rate among population between the ages 16 and 19 in the United States with a correlation coefficient (R) of -0.223 and weighted average of 36.9%, a difference of 3.2%.
In Labor Force | Age 16-19 Correlation Summary
| Measurement | Immigrants from England | Yakama |
| Minimum | 27.4% | 7.9% |
| Maximum | 100.0% | 100.0% |
| Range | 72.6% | 92.1% |
| Mean | 48.6% | 39.7% |
| Median | 42.5% | 35.4% |
| Interquartile 25% (IQ1) | 37.1% | 26.4% |
| Interquartile 75% (IQ3) | 51.9% | 44.0% |
| Interquartile Range (IQR) | 14.8% | 17.6% |
| Standard Deviation (Sample) | 18.4% | 24.2% |
| Standard Deviation (Population) | 18.1% | 23.7% |
Similar Demographics by In Labor Force | Age 16-19
Demographics Similar to Immigrants from England by In Labor Force | Age 16-19
In terms of in labor force | age 16-19, the demographic groups most similar to Immigrants from England are Seminole (38.1%, a difference of 0.080%), Immigrants from Africa (38.0%, a difference of 0.10%), African (38.0%, a difference of 0.26%), Choctaw (38.0%, a difference of 0.27%), and New Zealander (38.0%, a difference of 0.27%).
| Demographics | Rating | Rank | In Labor Force | Age 16-19 |
| Chickasaw | 97.8 /100 | #117 | Exceptional 38.3% |
| Immigrants | Nepal | 97.8 /100 | #118 | Exceptional 38.3% |
| Assyrians/Chaldeans/Syriacs | 97.8 /100 | #119 | Exceptional 38.3% |
| Ukrainians | 97.6 /100 | #120 | Exceptional 38.3% |
| Ethiopians | 97.4 /100 | #121 | Exceptional 38.2% |
| Guamanians/Chamorros | 97.4 /100 | #122 | Exceptional 38.2% |
| Seminole | 96.7 /100 | #123 | Exceptional 38.1% |
| Immigrants | England | 96.4 /100 | #124 | Exceptional 38.1% |
| Immigrants | Africa | 96.1 /100 | #125 | Exceptional 38.0% |
| Africans | 95.6 /100 | #126 | Exceptional 38.0% |
| Choctaw | 95.6 /100 | #127 | Exceptional 38.0% |
| New Zealanders | 95.6 /100 | #128 | Exceptional 38.0% |
| Spaniards | 95.5 /100 | #129 | Exceptional 38.0% |
| Immigrants | Zimbabwe | 95.4 /100 | #130 | Exceptional 38.0% |
| Immigrants | Austria | 95.0 /100 | #131 | Exceptional 37.9% |
Demographics Similar to Yakama by In Labor Force | Age 16-19
In terms of in labor force | age 16-19, the demographic groups most similar to Yakama are Immigrants from Western Africa (36.9%, a difference of 0.010%), Immigrants from Kuwait (36.9%, a difference of 0.11%), Bermudan (36.9%, a difference of 0.14%), Immigrants from Jordan (36.9%, a difference of 0.15%), and Arab (36.8%, a difference of 0.18%).
| Demographics | Rating | Rank | In Labor Force | Age 16-19 |
| Ute | 75.7 /100 | #158 | Good 37.1% |
| Yaqui | 74.4 /100 | #159 | Good 37.1% |
| Immigrants | Saudi Arabia | 73.9 /100 | #160 | Good 37.0% |
| Cambodians | 71.5 /100 | #161 | Good 37.0% |
| Immigrants | Jordan | 69.5 /100 | #162 | Good 36.9% |
| Bermudans | 69.3 /100 | #163 | Good 36.9% |
| Immigrants | Kuwait | 68.9 /100 | #164 | Good 36.9% |
| Yakama | 66.9 /100 | #165 | Good 36.9% |
| Immigrants | Western Africa | 66.7 /100 | #166 | Good 36.9% |
| Arabs | 63.6 /100 | #167 | Good 36.8% |
| Palestinians | 63.1 /100 | #168 | Good 36.8% |
| Immigrants | Latvia | 61.6 /100 | #169 | Good 36.8% |
| Immigrants | South Africa | 60.5 /100 | #170 | Good 36.8% |
| Immigrants | Cambodia | 58.4 /100 | #171 | Average 36.7% |
| South Africans | 58.3 /100 | #172 | Average 36.7% |