Immigrants from England vs Sudanese In Labor Force | Age 16-19
COMPARE
Immigrants from England
Sudanese
In Labor Force | Age 16-19
In Labor Force | Age 16-19 Comparison
Immigrants from England
Sudanese
38.1%
IN LABOR FORCE | AGE 16-19
96.4/ 100
METRIC RATING
124th/ 347
METRIC RANK
42.9%
IN LABOR FORCE | AGE 16-19
100.0/ 100
METRIC RATING
22nd/ 347
METRIC RANK
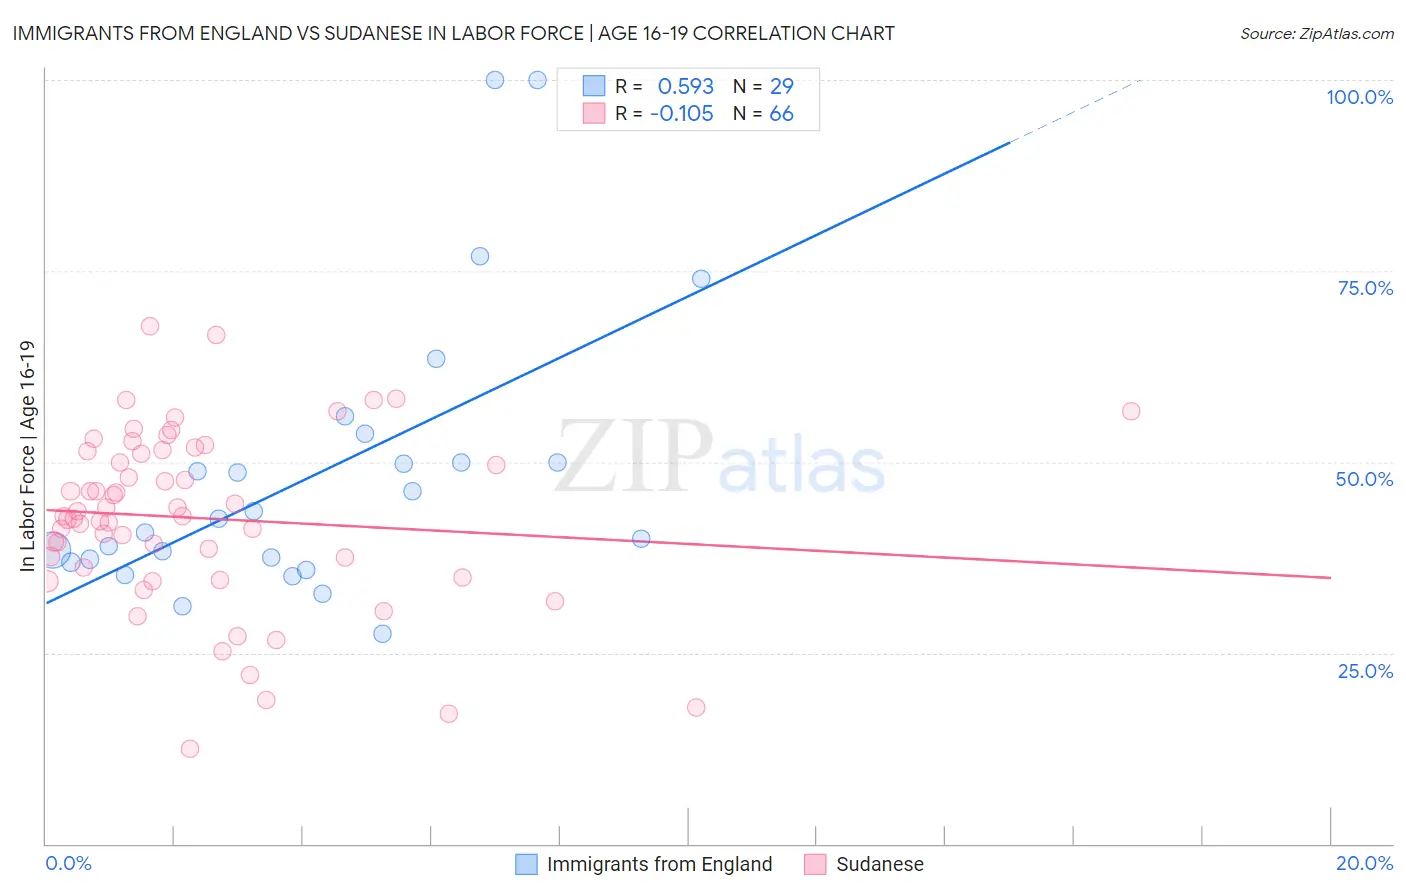
Immigrants from England vs Sudanese In Labor Force | Age 16-19 Correlation Chart
The statistical analysis conducted on geographies consisting of 391,103,684 people shows a substantial positive correlation between the proportion of Immigrants from England and labor force participation rate among population between the ages 16 and 19 in the United States with a correlation coefficient (R) of 0.593 and weighted average of 38.1%. Similarly, the statistical analysis conducted on geographies consisting of 110,142,178 people shows a poor negative correlation between the proportion of Sudanese and labor force participation rate among population between the ages 16 and 19 in the United States with a correlation coefficient (R) of -0.105 and weighted average of 42.9%, a difference of 12.5%.
In Labor Force | Age 16-19 Correlation Summary
| Measurement | Immigrants from England | Sudanese |
| Minimum | 27.4% | 12.5% |
| Maximum | 100.0% | 67.8% |
| Range | 72.6% | 55.3% |
| Mean | 48.6% | 42.6% |
| Median | 42.5% | 42.8% |
| Interquartile 25% (IQ1) | 37.1% | 36.1% |
| Interquartile 75% (IQ3) | 51.9% | 51.4% |
| Interquartile Range (IQR) | 14.8% | 15.3% |
| Standard Deviation (Sample) | 18.4% | 11.5% |
| Standard Deviation (Population) | 18.1% | 11.4% |
Similar Demographics by In Labor Force | Age 16-19
Demographics Similar to Immigrants from England by In Labor Force | Age 16-19
In terms of in labor force | age 16-19, the demographic groups most similar to Immigrants from England are Seminole (38.1%, a difference of 0.080%), Immigrants from Africa (38.0%, a difference of 0.10%), African (38.0%, a difference of 0.26%), Choctaw (38.0%, a difference of 0.27%), and New Zealander (38.0%, a difference of 0.27%).
| Demographics | Rating | Rank | In Labor Force | Age 16-19 |
| Chickasaw | 97.8 /100 | #117 | Exceptional 38.3% |
| Immigrants | Nepal | 97.8 /100 | #118 | Exceptional 38.3% |
| Assyrians/Chaldeans/Syriacs | 97.8 /100 | #119 | Exceptional 38.3% |
| Ukrainians | 97.6 /100 | #120 | Exceptional 38.3% |
| Ethiopians | 97.4 /100 | #121 | Exceptional 38.2% |
| Guamanians/Chamorros | 97.4 /100 | #122 | Exceptional 38.2% |
| Seminole | 96.7 /100 | #123 | Exceptional 38.1% |
| Immigrants | England | 96.4 /100 | #124 | Exceptional 38.1% |
| Immigrants | Africa | 96.1 /100 | #125 | Exceptional 38.0% |
| Africans | 95.6 /100 | #126 | Exceptional 38.0% |
| Choctaw | 95.6 /100 | #127 | Exceptional 38.0% |
| New Zealanders | 95.6 /100 | #128 | Exceptional 38.0% |
| Spaniards | 95.5 /100 | #129 | Exceptional 38.0% |
| Immigrants | Zimbabwe | 95.4 /100 | #130 | Exceptional 38.0% |
| Immigrants | Austria | 95.0 /100 | #131 | Exceptional 37.9% |
Demographics Similar to Sudanese by In Labor Force | Age 16-19
In terms of in labor force | age 16-19, the demographic groups most similar to Sudanese are Ottawa (43.0%, a difference of 0.40%), Slovak (42.6%, a difference of 0.59%), Bangladeshi (42.5%, a difference of 0.92%), Swiss (43.3%, a difference of 0.96%), and German Russian (42.4%, a difference of 1.0%).
| Demographics | Rating | Rank | In Labor Force | Age 16-19 |
| Slovenes | 100.0 /100 | #15 | Exceptional 43.7% |
| Czechs | 100.0 /100 | #16 | Exceptional 43.6% |
| Scandinavians | 100.0 /100 | #17 | Exceptional 43.6% |
| French Canadians | 100.0 /100 | #18 | Exceptional 43.6% |
| Belgians | 100.0 /100 | #19 | Exceptional 43.4% |
| Swiss | 100.0 /100 | #20 | Exceptional 43.3% |
| Ottawa | 100.0 /100 | #21 | Exceptional 43.0% |
| Sudanese | 100.0 /100 | #22 | Exceptional 42.9% |
| Slovaks | 100.0 /100 | #23 | Exceptional 42.6% |
| Bangladeshis | 100.0 /100 | #24 | Exceptional 42.5% |
| German Russians | 100.0 /100 | #25 | Exceptional 42.4% |
| English | 100.0 /100 | #26 | Exceptional 42.4% |
| Welsh | 100.0 /100 | #27 | Exceptional 42.3% |
| Poles | 100.0 /100 | #28 | Exceptional 42.1% |
| French | 100.0 /100 | #29 | Exceptional 42.1% |