Immigrants from Senegal vs Yakama In Labor Force | Age 16-19

COMPARE

Immigrants from Senegal
Race
Ancestry
AfghanAfricanAlaska NativeAlaskan AthabascanAlbanianAleutAlsatianAmericanApacheArabArapahoArgentineanArmenianAssyrian/Chaldean/SyriacAustralianAustrianBahamianBangladeshiBarbadianBasqueBelgianBelizeanBermudanBhutaneseBlackfeetBolivianBrazilianBritishBritish West IndianBulgarianBurmeseCajunCambodianCanadianCape VerdeanCarpatho RusynCelticCentral AmericanCentral American IndianCherokeeCheyenneChickasawChileanChineseChippewaChoctawColombianColvilleComancheCosta RicanCreeCreekCroatianCrowCubanCypriotCzechCzechoslovakianDanishDelawareDominicanDutchDutch West IndianEastern EuropeanEcuadorianEgyptianEnglishEstonianEthiopianEuropeanFijianFilipinoFinnishFrenchFrench American IndianFrench CanadianGermanGerman RussianGhanaianGreekGuamanian/ChamorroGuatemalanGuyaneseHaitianHmongHonduranHopiHoumaHungarianIcelanderIndian (Asian)IndonesianInupiatIranianIraqiIrishIroquoisIsraeliItalianJamaicanJapaneseJordanianKenyanKiowaKoreanLaotianLatvianLebaneseLiberianLithuanianLumbeeLuxembourgerMacedonianMalaysianMalteseMarshalleseMenomineeMexicanMexican American IndianMongolianMoroccanNative HawaiianNavajoNepaleseNew ZealanderNicaraguanNigerianNorthern EuropeanNorwegianOkinawanOsageOttawaPaiutePakistaniPalestinianPanamanianParaguayanPennsylvania GermanPeruvianPimaPolishPortuguesePotawatomiPuebloPuerto RicanPuget Sound SalishRomanianRussianSalvadoranSamoanScandinavianScotch-IrishScottishSeminoleSenegaleseSerbianShoshoneSierra LeoneanSiouxSlavicSlovakSloveneSomaliSouth AfricanSouth AmericanSouth American IndianSoviet UnionSpaniardSpanishSpanish AmericanSpanish American IndianSri LankanSubsaharan AfricanSudaneseSwedishSwissSyrianTaiwaneseThaiTlingit-HaidaTohono O'OdhamTonganTrinidadian and TobagonianTsimshianTurkishU.S. Virgin IslanderUgandanUkrainianUruguayanUteVenezuelanVietnameseWelshWest IndianYaquiYugoslavianYumanYup'ikZimbabwean
Immigration
NonimmigrantsImmigrantsAfghanistanAfricaAlbaniaArgentinaArmeniaAsiaAustraliaAustriaBahamasBangladeshBarbadosBelarusBelgiumBelizeBoliviaBosnia and HerzegovinaBrazilBulgariaBurma/MyanmarCabo VerdeCambodiaCameroonCanadaCaribbeanCentral AmericaChileChinaColombiaCongoCosta RicaCroatiaCubaCzechoslovakiaDenmarkDominicaDominican RepublicEastern AfricaEastern AsiaEastern EuropeEcuadorEgyptEl SalvadorEnglandEritreaEthiopiaEuropeFijiFranceGermanyGhanaGreeceGrenadaGuatemalaGuyanaHaitiHondurasHong KongHungaryIndiaIndonesiaIranIraqIrelandIsraelItalyJamaicaJapanJordanKazakhstanKenyaKoreaKuwaitLaosLatin AmericaLatviaLebanonLiberiaLithuaniaMalaysiaMexicoMicronesiaMiddle AfricaMoldovaMoroccoNepalNetherlandsNicaraguaNigeriaNorth AmericaNorth MacedoniaNorthern AfricaNorthern EuropeNorwayOceaniaPakistanPanamaPeruPhilippinesPolandPortugalRomaniaRussiaSaudi ArabiaScotlandSenegalSerbiaSierra LeoneSingaporeSomaliaSouth AfricaSouth AmericaSouth Central AsiaSouth Eastern AsiaSouthern EuropeSpainSri LankaSt. Vincent and the GrenadinesSudanSwedenSwitzerlandSyriaTaiwanThailandTrinidad and TobagoTurkeyUgandaUkraineUruguayUzbekistanVenezuelaVietnamWest IndiesWestern AfricaWestern AsiaWestern EuropeYemenZaireZimbabweAzores
Yakama
Race
Ancestry
AfghanAfricanAlaska NativeAlaskan AthabascanAlbanianAleutAlsatianAmericanApacheArabArapahoArgentineanArmenianAssyrian/Chaldean/SyriacAustralianAustrianBahamianBangladeshiBarbadianBasqueBelgianBelizeanBermudanBhutaneseBlackfeetBolivianBrazilianBritishBritish West IndianBulgarianBurmeseCajunCambodianCanadianCape VerdeanCarpatho RusynCelticCentral AmericanCentral American IndianCherokeeCheyenneChickasawChileanChineseChippewaChoctawColombianColvilleComancheCosta RicanCreeCreekCroatianCrowCubanCypriotCzechCzechoslovakianDanishDelawareDominicanDutchDutch West IndianEastern EuropeanEcuadorianEgyptianEnglishEstonianEthiopianEuropeanFijianFilipinoFinnishFrenchFrench American IndianFrench CanadianGermanGerman RussianGhanaianGreekGuamanian/ChamorroGuatemalanGuyaneseHaitianHmongHonduranHopiHoumaHungarianIcelanderIndian (Asian)IndonesianInupiatIranianIraqiIrishIroquoisIsraeliItalianJamaicanJapaneseJordanianKenyanKiowaKoreanLaotianLatvianLebaneseLiberianLithuanianLumbeeLuxembourgerMacedonianMalaysianMalteseMarshalleseMenomineeMexicanMexican American IndianMongolianMoroccanNative HawaiianNavajoNepaleseNew ZealanderNicaraguanNigerianNorthern EuropeanNorwegianOkinawanOsageOttawaPaiutePakistaniPalestinianPanamanianParaguayanPennsylvania GermanPeruvianPimaPolishPortuguesePotawatomiPuebloPuerto RicanPuget Sound SalishRomanianRussianSalvadoranSamoanScandinavianScotch-IrishScottishSeminoleSenegaleseSerbianShoshoneSierra LeoneanSiouxSlavicSlovakSloveneSomaliSouth AfricanSouth AmericanSouth American IndianSoviet UnionSpaniardSpanishSpanish AmericanSpanish American IndianSri LankanSubsaharan AfricanSudaneseSwedishSwissSyrianTaiwaneseThaiTlingit-HaidaTohono O'OdhamTonganTrinidadian and TobagonianTsimshianTurkishU.S. Virgin IslanderUgandanUkrainianUruguayanUteVenezuelanVietnameseWelshWest IndianYakamaYaquiYugoslavianYumanYup'ikZimbabwean
Immigration
NonimmigrantsImmigrantsAfghanistanAfricaAlbaniaArgentinaArmeniaAsiaAustraliaAustriaBahamasBangladeshBarbadosBelarusBelgiumBelizeBoliviaBosnia and HerzegovinaBrazilBulgariaBurma/MyanmarCabo VerdeCambodiaCameroonCanadaCaribbeanCentral AmericaChileChinaColombiaCongoCosta RicaCroatiaCubaCzechoslovakiaDenmarkDominicaDominican RepublicEastern AfricaEastern AsiaEastern EuropeEcuadorEgyptEl SalvadorEnglandEritreaEthiopiaEuropeFijiFranceGermanyGhanaGreeceGrenadaGuatemalaGuyanaHaitiHondurasHong KongHungaryIndiaIndonesiaIranIraqIrelandIsraelItalyJamaicaJapanJordanKazakhstanKenyaKoreaKuwaitLaosLatin AmericaLatviaLebanonLiberiaLithuaniaMalaysiaMexicoMicronesiaMiddle AfricaMoldovaMoroccoNepalNetherlandsNicaraguaNigeriaNorth AmericaNorth MacedoniaNorthern AfricaNorthern EuropeNorwayOceaniaPakistanPanamaPeruPhilippinesPolandPortugalRomaniaRussiaSaudi ArabiaScotlandSerbiaSierra LeoneSingaporeSomaliaSouth AfricaSouth AmericaSouth Central AsiaSouth Eastern AsiaSouthern EuropeSpainSri LankaSt. Vincent and the GrenadinesSudanSwedenSwitzerlandSyriaTaiwanThailandTrinidad and TobagoTurkeyUgandaUkraineUruguayUzbekistanVenezuelaVietnamWest IndiesWestern AfricaWestern AsiaWestern EuropeYemenZaireZimbabweAzores
In Labor Force | Age 16-19
Income
Poverty
Unemployment
Labor Participation
Family Structure
Vehicle Availability
Education Level
Disability

In Labor Force | Age 16-19 Comparison

Immigrants from Senegal

Yakama

Tragic
Good
35.3%
IN LABOR FORCE | AGE 16-19
5.5/ 100
METRIC RATING
228th/ 347
METRIC RANK
36.9%
IN LABOR FORCE | AGE 16-19
66.9/ 100
METRIC RATING
165th/ 347
METRIC RANK

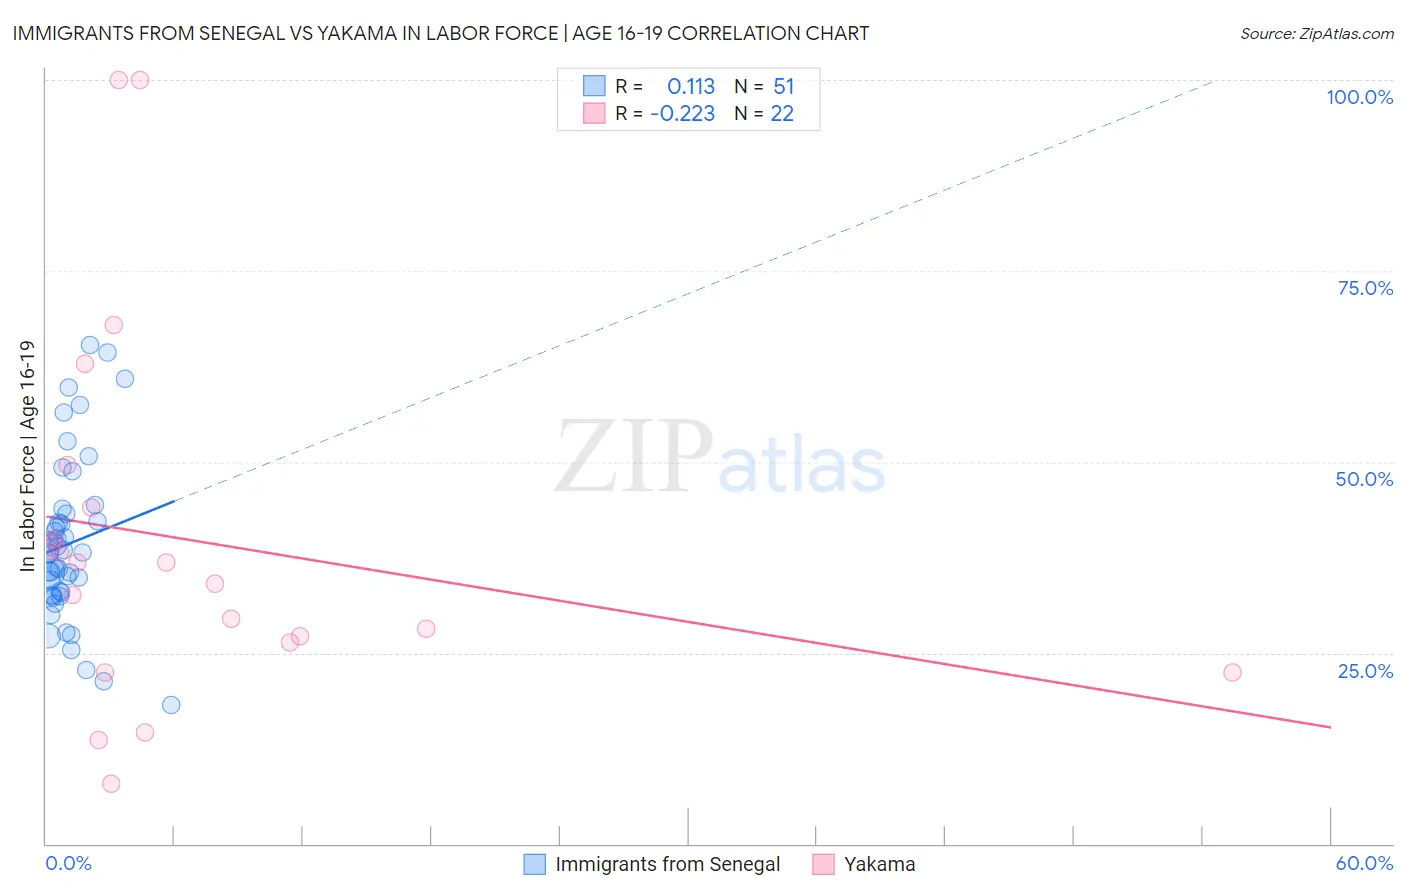
Immigrants from Senegal vs Yakama In Labor Force | Age 16-19 Correlation Chart

The statistical analysis conducted on geographies consisting of 90,105,312 people shows a poor positive correlation between the proportion of Immigrants from Senegal and labor force participation rate among population between the ages 16 and 19 in the United States with a correlation coefficient (R) of 0.113 and weighted average of 35.3%. Similarly, the statistical analysis conducted on geographies consisting of 19,894,194 people shows a weak negative correlation between the proportion of Yakama and labor force participation rate among population between the ages 16 and 19 in the United States with a correlation coefficient (R) of -0.223 and weighted average of 36.9%, a difference of 4.6%.
Immigrants from Senegal vs Yakama In Labor Force | Age 16-19

In Labor Force | Age 16-19 Correlation Summary

MeasurementImmigrants from SenegalYakama
Minimum18.2%7.9%
Maximum65.3%100.0%
Range47.1%92.1%
Mean39.3%39.7%
Median38.2%35.4%
Interquartile 25% (IQ1)32.6%26.4%
Interquartile 75% (IQ3)43.1%44.0%
Interquartile Range (IQR)10.5%17.6%
Standard Deviation (Sample)10.6%24.2%
Standard Deviation (Population)10.5%23.7%

Similar Demographics by In Labor Force | Age 16-19

Demographics Similar to Immigrants from Senegal by In Labor Force | Age 16-19

In terms of in labor force | age 16-19, the demographic groups most similar to Immigrants from Senegal are Mongolian (35.3%, a difference of 0.050%), Immigrants from Guatemala (35.3%, a difference of 0.060%), Immigrants from Lebanon (35.2%, a difference of 0.13%), Immigrants from Belgium (35.3%, a difference of 0.15%), and Immigrants from Honduras (35.2%, a difference of 0.16%).
DemographicsRating | RankIn Labor Force | Age 16-19
Turks
7.3
/100
|
#221
Tragic
35.4%
Immigrants | Ghana
7.3
/100
|
#222
Tragic
35.4%
Ghanaians
6.5
/100
|
#223
Tragic
35.3%
Hondurans
6.5
/100
|
#224
Tragic
35.3%
Immigrants | Belgium
6.1
/100
|
#225
Tragic
35.3%
Immigrants | Guatemala
5.7
/100
|
#226
Tragic
35.3%
Mongolians
5.7
/100
|
#227
Tragic
35.3%
Immigrants | Senegal
5.5
/100
|
#228
Tragic
35.3%
Immigrants | Lebanon
5.0
/100
|
#229
Tragic
35.2%
Immigrants | Honduras
4.9
/100
|
#230
Tragic
35.2%
Immigrants | Syria
4.5
/100
|
#231
Tragic
35.2%
Immigrants | Kazakhstan
4.5
/100
|
#232
Tragic
35.2%
Immigrants | France
4.3
/100
|
#233
Tragic
35.1%
Immigrants | Mexico
4.2
/100
|
#234
Tragic
35.1%
Immigrants | Philippines
4.0
/100
|
#235
Tragic
35.1%

Demographics Similar to Yakama by In Labor Force | Age 16-19

In terms of in labor force | age 16-19, the demographic groups most similar to Yakama are Immigrants from Western Africa (36.9%, a difference of 0.010%), Immigrants from Kuwait (36.9%, a difference of 0.11%), Bermudan (36.9%, a difference of 0.14%), Immigrants from Jordan (36.9%, a difference of 0.15%), and Arab (36.8%, a difference of 0.18%).
DemographicsRating | RankIn Labor Force | Age 16-19
Ute
75.7
/100
|
#158
Good
37.1%
Yaqui
74.4
/100
|
#159
Good
37.1%
Immigrants | Saudi Arabia
73.9
/100
|
#160
Good
37.0%
Cambodians
71.5
/100
|
#161
Good
37.0%
Immigrants | Jordan
69.5
/100
|
#162
Good
36.9%
Bermudans
69.3
/100
|
#163
Good
36.9%
Immigrants | Kuwait
68.9
/100
|
#164
Good
36.9%
Yakama
66.9
/100
|
#165
Good
36.9%
Immigrants | Western Africa
66.7
/100
|
#166
Good
36.9%
Arabs
63.6
/100
|
#167
Good
36.8%
Palestinians
63.1
/100
|
#168
Good
36.8%
Immigrants | Latvia
61.6
/100
|
#169
Good
36.8%
Immigrants | South Africa
60.5
/100
|
#170
Good
36.8%
Immigrants | Cambodia
58.4
/100
|
#171
Average
36.7%
South Africans
58.3
/100
|
#172
Average
36.7%