Immigrants from England vs Immigrants from Western Asia In Labor Force | Age 16-19
COMPARE
Immigrants from England
Immigrants from Western Asia
In Labor Force | Age 16-19
In Labor Force | Age 16-19 Comparison
Immigrants from England
Immigrants from Western Asia
38.1%
IN LABOR FORCE | AGE 16-19
96.4/ 100
METRIC RATING
124th/ 347
METRIC RANK
34.8%
IN LABOR FORCE | AGE 16-19
2.0/ 100
METRIC RATING
251st/ 347
METRIC RANK
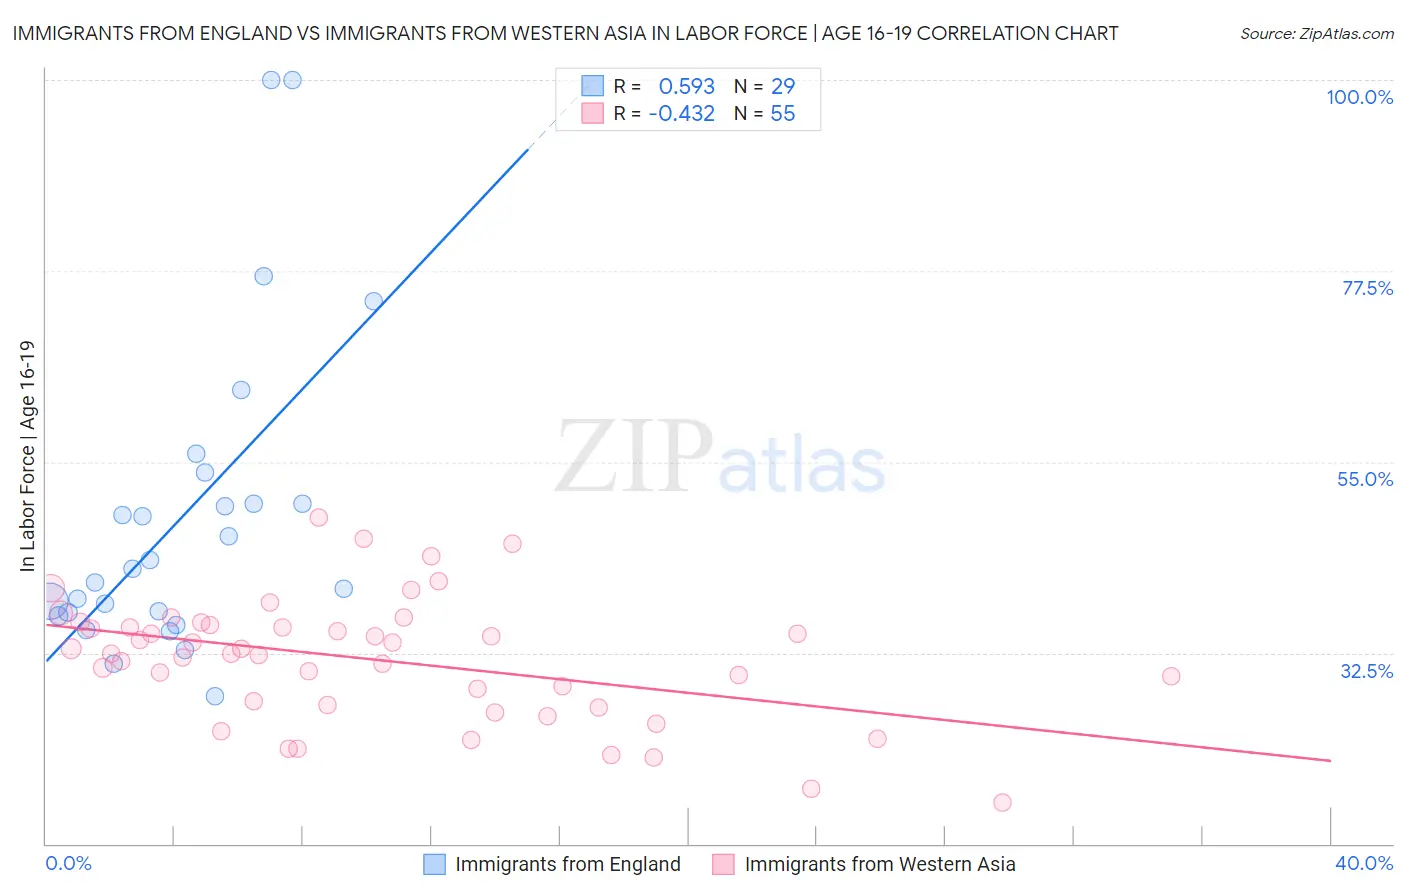
Immigrants from England vs Immigrants from Western Asia In Labor Force | Age 16-19 Correlation Chart
The statistical analysis conducted on geographies consisting of 391,103,684 people shows a substantial positive correlation between the proportion of Immigrants from England and labor force participation rate among population between the ages 16 and 19 in the United States with a correlation coefficient (R) of 0.593 and weighted average of 38.1%. Similarly, the statistical analysis conducted on geographies consisting of 403,680,929 people shows a moderate negative correlation between the proportion of Immigrants from Western Asia and labor force participation rate among population between the ages 16 and 19 in the United States with a correlation coefficient (R) of -0.432 and weighted average of 34.8%, a difference of 9.5%.
In Labor Force | Age 16-19 Correlation Summary
| Measurement | Immigrants from England | Immigrants from Western Asia |
| Minimum | 27.4% | 14.9% |
| Maximum | 100.0% | 48.4% |
| Range | 72.6% | 33.5% |
| Mean | 48.6% | 31.7% |
| Median | 42.5% | 32.4% |
| Interquartile 25% (IQ1) | 37.1% | 26.4% |
| Interquartile 75% (IQ3) | 51.9% | 35.7% |
| Interquartile Range (IQR) | 14.8% | 9.3% |
| Standard Deviation (Sample) | 18.4% | 7.2% |
| Standard Deviation (Population) | 18.1% | 7.2% |
Similar Demographics by In Labor Force | Age 16-19
Demographics Similar to Immigrants from England by In Labor Force | Age 16-19
In terms of in labor force | age 16-19, the demographic groups most similar to Immigrants from England are Seminole (38.1%, a difference of 0.080%), Immigrants from Africa (38.0%, a difference of 0.10%), African (38.0%, a difference of 0.26%), Choctaw (38.0%, a difference of 0.27%), and New Zealander (38.0%, a difference of 0.27%).
| Demographics | Rating | Rank | In Labor Force | Age 16-19 |
| Chickasaw | 97.8 /100 | #117 | Exceptional 38.3% |
| Immigrants | Nepal | 97.8 /100 | #118 | Exceptional 38.3% |
| Assyrians/Chaldeans/Syriacs | 97.8 /100 | #119 | Exceptional 38.3% |
| Ukrainians | 97.6 /100 | #120 | Exceptional 38.3% |
| Ethiopians | 97.4 /100 | #121 | Exceptional 38.2% |
| Guamanians/Chamorros | 97.4 /100 | #122 | Exceptional 38.2% |
| Seminole | 96.7 /100 | #123 | Exceptional 38.1% |
| Immigrants | England | 96.4 /100 | #124 | Exceptional 38.1% |
| Immigrants | Africa | 96.1 /100 | #125 | Exceptional 38.0% |
| Africans | 95.6 /100 | #126 | Exceptional 38.0% |
| Choctaw | 95.6 /100 | #127 | Exceptional 38.0% |
| New Zealanders | 95.6 /100 | #128 | Exceptional 38.0% |
| Spaniards | 95.5 /100 | #129 | Exceptional 38.0% |
| Immigrants | Zimbabwe | 95.4 /100 | #130 | Exceptional 38.0% |
| Immigrants | Austria | 95.0 /100 | #131 | Exceptional 37.9% |
Demographics Similar to Immigrants from Western Asia by In Labor Force | Age 16-19
In terms of in labor force | age 16-19, the demographic groups most similar to Immigrants from Western Asia are Immigrants from Chile (34.8%, a difference of 0.010%), Immigrants from Pakistan (34.8%, a difference of 0.020%), Immigrants from Ukraine (34.8%, a difference of 0.12%), Central American (34.8%, a difference of 0.15%), and Laotian (34.9%, a difference of 0.23%).
| Demographics | Rating | Rank | In Labor Force | Age 16-19 |
| Immigrants | Turkey | 2.6 /100 | #244 | Tragic 34.9% |
| Immigrants | Greece | 2.4 /100 | #245 | Tragic 34.9% |
| Immigrants | Sri Lanka | 2.4 /100 | #246 | Tragic 34.9% |
| Laotians | 2.4 /100 | #247 | Tragic 34.9% |
| Central Americans | 2.2 /100 | #248 | Tragic 34.8% |
| Immigrants | Ukraine | 2.2 /100 | #249 | Tragic 34.8% |
| Immigrants | Pakistan | 2.0 /100 | #250 | Tragic 34.8% |
| Immigrants | Western Asia | 2.0 /100 | #251 | Tragic 34.8% |
| Immigrants | Chile | 2.0 /100 | #252 | Tragic 34.8% |
| Immigrants | Japan | 1.5 /100 | #253 | Tragic 34.7% |
| Bahamians | 1.4 /100 | #254 | Tragic 34.6% |
| Peruvians | 1.4 /100 | #255 | Tragic 34.6% |
| Immigrants | South Central Asia | 1.3 /100 | #256 | Tragic 34.6% |
| Immigrants | Egypt | 1.2 /100 | #257 | Tragic 34.6% |
| Thais | 1.2 /100 | #258 | Tragic 34.6% |