Taiwanese vs Yakama In Labor Force | Age 16-19
COMPARE
Taiwanese
Yakama
In Labor Force | Age 16-19
In Labor Force | Age 16-19 Comparison
Taiwanese
Yakama
33.8%
IN LABOR FORCE | AGE 16-19
0.3/ 100
METRIC RATING
280th/ 347
METRIC RANK
36.9%
IN LABOR FORCE | AGE 16-19
66.9/ 100
METRIC RATING
165th/ 347
METRIC RANK
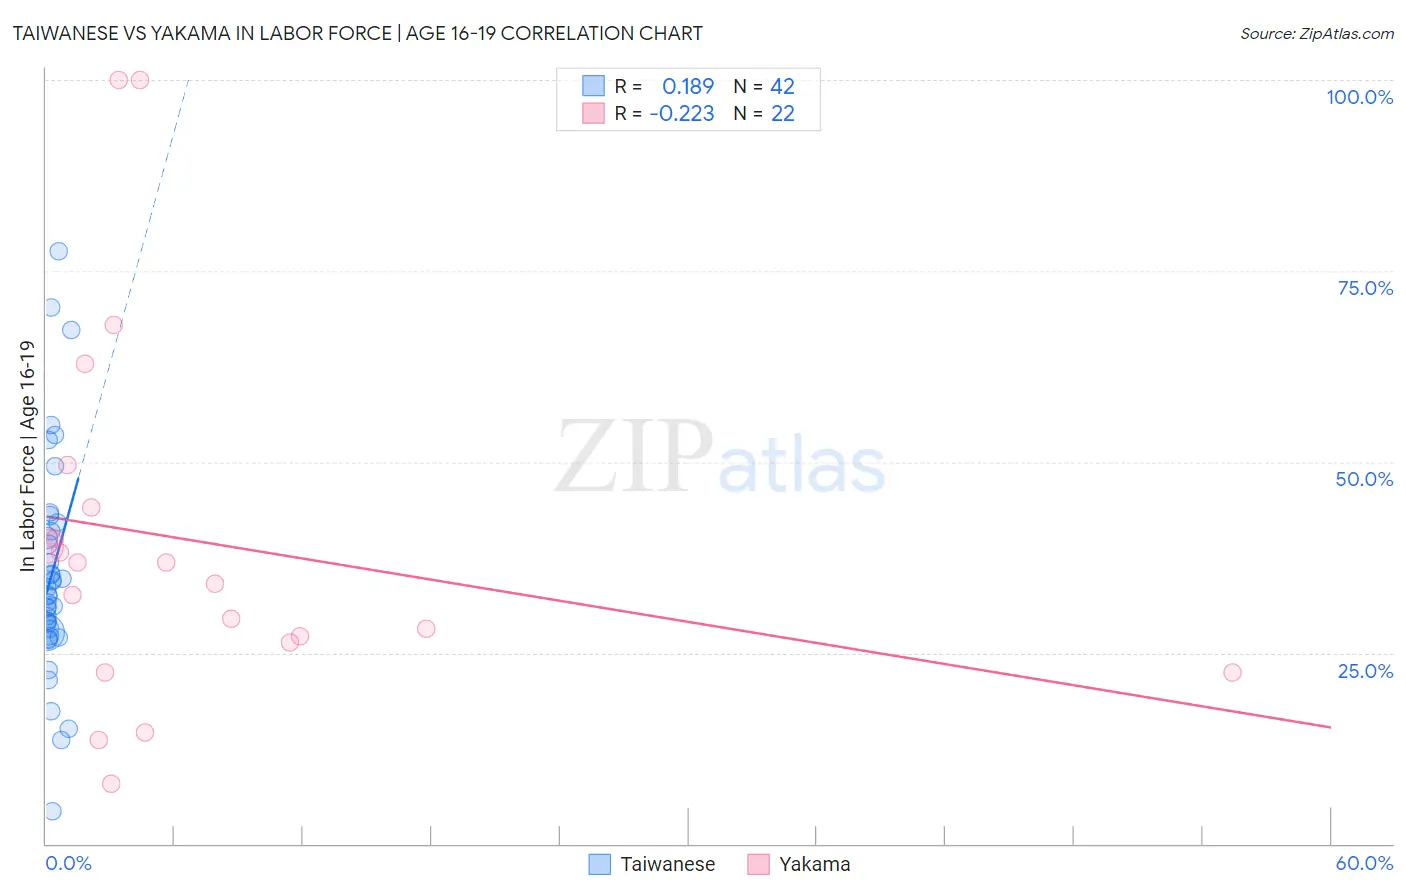
Taiwanese vs Yakama In Labor Force | Age 16-19 Correlation Chart
The statistical analysis conducted on geographies consisting of 31,721,298 people shows a poor positive correlation between the proportion of Taiwanese and labor force participation rate among population between the ages 16 and 19 in the United States with a correlation coefficient (R) of 0.189 and weighted average of 33.8%. Similarly, the statistical analysis conducted on geographies consisting of 19,894,194 people shows a weak negative correlation between the proportion of Yakama and labor force participation rate among population between the ages 16 and 19 in the United States with a correlation coefficient (R) of -0.223 and weighted average of 36.9%, a difference of 9.1%.
In Labor Force | Age 16-19 Correlation Summary
| Measurement | Taiwanese | Yakama |
| Minimum | 4.3% | 7.9% |
| Maximum | 77.6% | 100.0% |
| Range | 73.3% | 92.1% |
| Mean | 35.3% | 39.7% |
| Median | 32.5% | 35.4% |
| Interquartile 25% (IQ1) | 27.6% | 26.4% |
| Interquartile 75% (IQ3) | 40.9% | 44.0% |
| Interquartile Range (IQR) | 13.3% | 17.6% |
| Standard Deviation (Sample) | 14.5% | 24.2% |
| Standard Deviation (Population) | 14.3% | 23.7% |
Similar Demographics by In Labor Force | Age 16-19
Demographics Similar to Taiwanese by In Labor Force | Age 16-19
In terms of in labor force | age 16-19, the demographic groups most similar to Taiwanese are Paraguayan (33.8%, a difference of 0.010%), Cypriot (33.8%, a difference of 0.010%), Colombian (33.8%, a difference of 0.020%), Immigrants from Korea (33.8%, a difference of 0.020%), and Menominee (33.9%, a difference of 0.090%).
| Demographics | Rating | Rank | In Labor Force | Age 16-19 |
| Immigrants | Panama | 0.4 /100 | #273 | Tragic 34.0% |
| Venezuelans | 0.3 /100 | #274 | Tragic 34.0% |
| Immigrants | Fiji | 0.3 /100 | #275 | Tragic 33.9% |
| Immigrants | Latin America | 0.3 /100 | #276 | Tragic 33.9% |
| Menominee | 0.3 /100 | #277 | Tragic 33.9% |
| Colombians | 0.3 /100 | #278 | Tragic 33.8% |
| Paraguayans | 0.3 /100 | #279 | Tragic 33.8% |
| Taiwanese | 0.3 /100 | #280 | Tragic 33.8% |
| Cypriots | 0.3 /100 | #281 | Tragic 33.8% |
| Immigrants | Korea | 0.3 /100 | #282 | Tragic 33.8% |
| Immigrants | Venezuela | 0.2 /100 | #283 | Tragic 33.7% |
| Immigrants | Spain | 0.2 /100 | #284 | Tragic 33.7% |
| U.S. Virgin Islanders | 0.2 /100 | #285 | Tragic 33.6% |
| South Americans | 0.2 /100 | #286 | Tragic 33.6% |
| Nepalese | 0.1 /100 | #287 | Tragic 33.5% |
Demographics Similar to Yakama by In Labor Force | Age 16-19
In terms of in labor force | age 16-19, the demographic groups most similar to Yakama are Immigrants from Western Africa (36.9%, a difference of 0.010%), Immigrants from Kuwait (36.9%, a difference of 0.11%), Bermudan (36.9%, a difference of 0.14%), Immigrants from Jordan (36.9%, a difference of 0.15%), and Arab (36.8%, a difference of 0.18%).
| Demographics | Rating | Rank | In Labor Force | Age 16-19 |
| Ute | 75.7 /100 | #158 | Good 37.1% |
| Yaqui | 74.4 /100 | #159 | Good 37.1% |
| Immigrants | Saudi Arabia | 73.9 /100 | #160 | Good 37.0% |
| Cambodians | 71.5 /100 | #161 | Good 37.0% |
| Immigrants | Jordan | 69.5 /100 | #162 | Good 36.9% |
| Bermudans | 69.3 /100 | #163 | Good 36.9% |
| Immigrants | Kuwait | 68.9 /100 | #164 | Good 36.9% |
| Yakama | 66.9 /100 | #165 | Good 36.9% |
| Immigrants | Western Africa | 66.7 /100 | #166 | Good 36.9% |
| Arabs | 63.6 /100 | #167 | Good 36.8% |
| Palestinians | 63.1 /100 | #168 | Good 36.8% |
| Immigrants | Latvia | 61.6 /100 | #169 | Good 36.8% |
| Immigrants | South Africa | 60.5 /100 | #170 | Good 36.8% |
| Immigrants | Cambodia | 58.4 /100 | #171 | Average 36.7% |
| South Africans | 58.3 /100 | #172 | Average 36.7% |