Immigrants from England vs Hopi In Labor Force | Age 16-19
COMPARE
Immigrants from England
Hopi
In Labor Force | Age 16-19
In Labor Force | Age 16-19 Comparison
Immigrants from England
Hopi
38.1%
IN LABOR FORCE | AGE 16-19
96.4/ 100
METRIC RATING
124th/ 347
METRIC RANK
31.8%
IN LABOR FORCE | AGE 16-19
0.0/ 100
METRIC RATING
313th/ 347
METRIC RANK
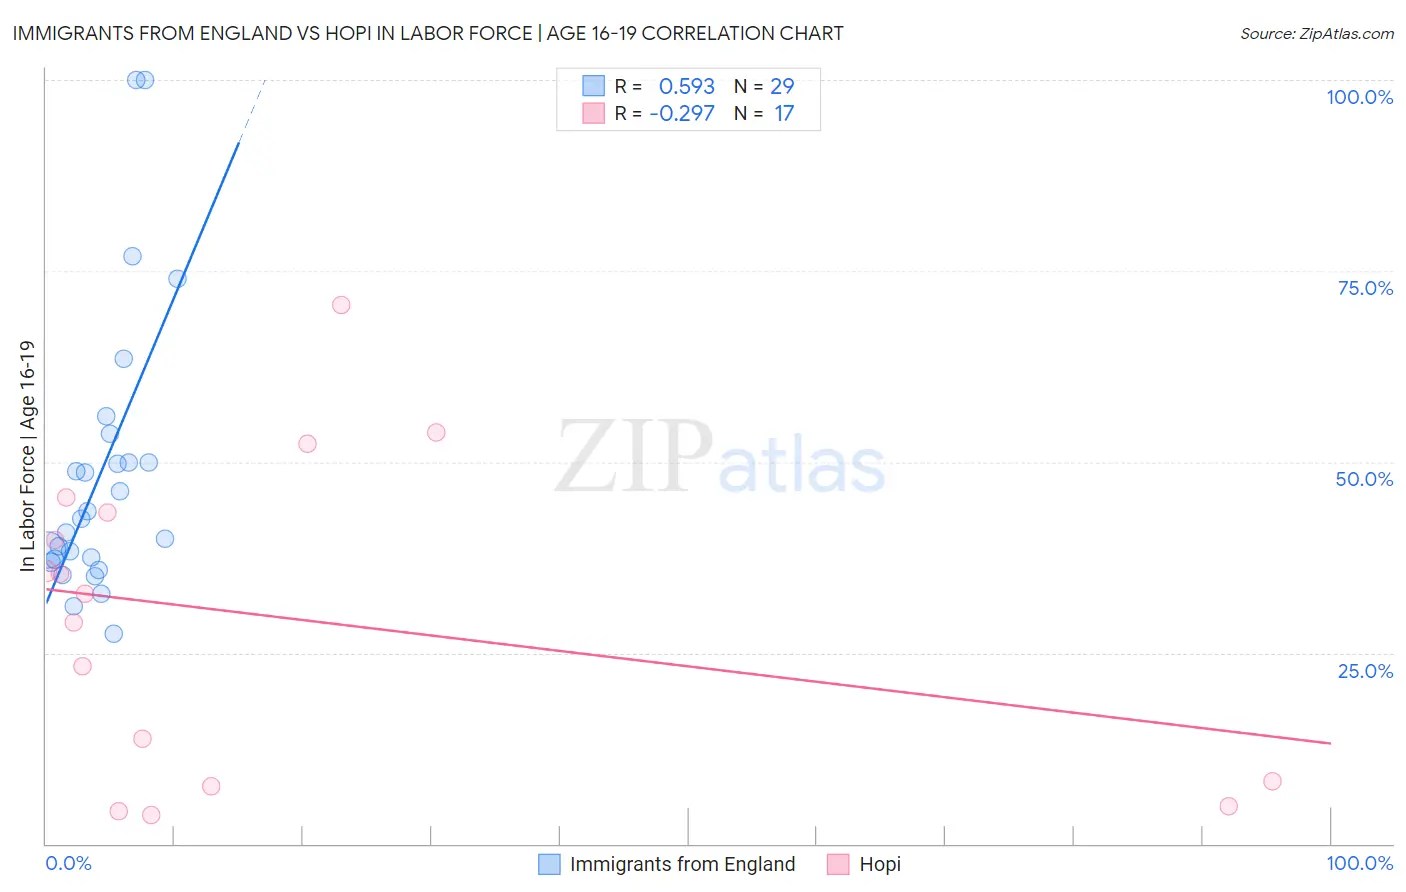
Immigrants from England vs Hopi In Labor Force | Age 16-19 Correlation Chart
The statistical analysis conducted on geographies consisting of 391,103,684 people shows a substantial positive correlation between the proportion of Immigrants from England and labor force participation rate among population between the ages 16 and 19 in the United States with a correlation coefficient (R) of 0.593 and weighted average of 38.1%. Similarly, the statistical analysis conducted on geographies consisting of 74,695,937 people shows a weak negative correlation between the proportion of Hopi and labor force participation rate among population between the ages 16 and 19 in the United States with a correlation coefficient (R) of -0.297 and weighted average of 31.8%, a difference of 19.7%.
In Labor Force | Age 16-19 Correlation Summary
| Measurement | Immigrants from England | Hopi |
| Minimum | 27.4% | 3.8% |
| Maximum | 100.0% | 70.5% |
| Range | 72.6% | 66.7% |
| Mean | 48.6% | 29.6% |
| Median | 42.5% | 32.7% |
| Interquartile 25% (IQ1) | 37.1% | 7.9% |
| Interquartile 75% (IQ3) | 51.9% | 44.4% |
| Interquartile Range (IQR) | 14.8% | 36.5% |
| Standard Deviation (Sample) | 18.4% | 20.2% |
| Standard Deviation (Population) | 18.1% | 19.6% |
Similar Demographics by In Labor Force | Age 16-19
Demographics Similar to Immigrants from England by In Labor Force | Age 16-19
In terms of in labor force | age 16-19, the demographic groups most similar to Immigrants from England are Seminole (38.1%, a difference of 0.080%), Immigrants from Africa (38.0%, a difference of 0.10%), African (38.0%, a difference of 0.26%), Choctaw (38.0%, a difference of 0.27%), and New Zealander (38.0%, a difference of 0.27%).
| Demographics | Rating | Rank | In Labor Force | Age 16-19 |
| Chickasaw | 97.8 /100 | #117 | Exceptional 38.3% |
| Immigrants | Nepal | 97.8 /100 | #118 | Exceptional 38.3% |
| Assyrians/Chaldeans/Syriacs | 97.8 /100 | #119 | Exceptional 38.3% |
| Ukrainians | 97.6 /100 | #120 | Exceptional 38.3% |
| Ethiopians | 97.4 /100 | #121 | Exceptional 38.2% |
| Guamanians/Chamorros | 97.4 /100 | #122 | Exceptional 38.2% |
| Seminole | 96.7 /100 | #123 | Exceptional 38.1% |
| Immigrants | England | 96.4 /100 | #124 | Exceptional 38.1% |
| Immigrants | Africa | 96.1 /100 | #125 | Exceptional 38.0% |
| Africans | 95.6 /100 | #126 | Exceptional 38.0% |
| Choctaw | 95.6 /100 | #127 | Exceptional 38.0% |
| New Zealanders | 95.6 /100 | #128 | Exceptional 38.0% |
| Spaniards | 95.5 /100 | #129 | Exceptional 38.0% |
| Immigrants | Zimbabwe | 95.4 /100 | #130 | Exceptional 38.0% |
| Immigrants | Austria | 95.0 /100 | #131 | Exceptional 37.9% |
Demographics Similar to Hopi by In Labor Force | Age 16-19
In terms of in labor force | age 16-19, the demographic groups most similar to Hopi are Immigrants from Belize (31.8%, a difference of 0.010%), Indian (Asian) (31.9%, a difference of 0.15%), Cuban (31.8%, a difference of 0.16%), Immigrants from West Indies (31.7%, a difference of 0.34%), and Filipino (31.7%, a difference of 0.42%).
| Demographics | Rating | Rank | In Labor Force | Age 16-19 |
| Spanish American Indians | 0.0 /100 | #306 | Tragic 32.4% |
| Immigrants | Jamaica | 0.0 /100 | #307 | Tragic 32.2% |
| Navajo | 0.0 /100 | #308 | Tragic 32.1% |
| Immigrants | Eastern Asia | 0.0 /100 | #309 | Tragic 32.0% |
| Immigrants | Iran | 0.0 /100 | #310 | Tragic 32.0% |
| Indians (Asian) | 0.0 /100 | #311 | Tragic 31.9% |
| Immigrants | Belize | 0.0 /100 | #312 | Tragic 31.8% |
| Hopi | 0.0 /100 | #313 | Tragic 31.8% |
| Cubans | 0.0 /100 | #314 | Tragic 31.8% |
| Immigrants | West Indies | 0.0 /100 | #315 | Tragic 31.7% |
| Filipinos | 0.0 /100 | #316 | Tragic 31.7% |
| Immigrants | Nicaragua | 0.0 /100 | #317 | Tragic 31.6% |
| Immigrants | Yemen | 0.0 /100 | #318 | Tragic 31.5% |
| Soviet Union | 0.0 /100 | #319 | Tragic 31.4% |
| Ecuadorians | 0.0 /100 | #320 | Tragic 31.4% |