Immigrants from Zimbabwe vs Yakama In Labor Force | Age 16-19
COMPARE
Immigrants from Zimbabwe
Yakama
In Labor Force | Age 16-19
In Labor Force | Age 16-19 Comparison
Immigrants from Zimbabwe
Yakama
38.0%
IN LABOR FORCE | AGE 16-19
95.4/ 100
METRIC RATING
130th/ 347
METRIC RANK
36.9%
IN LABOR FORCE | AGE 16-19
66.9/ 100
METRIC RATING
165th/ 347
METRIC RANK
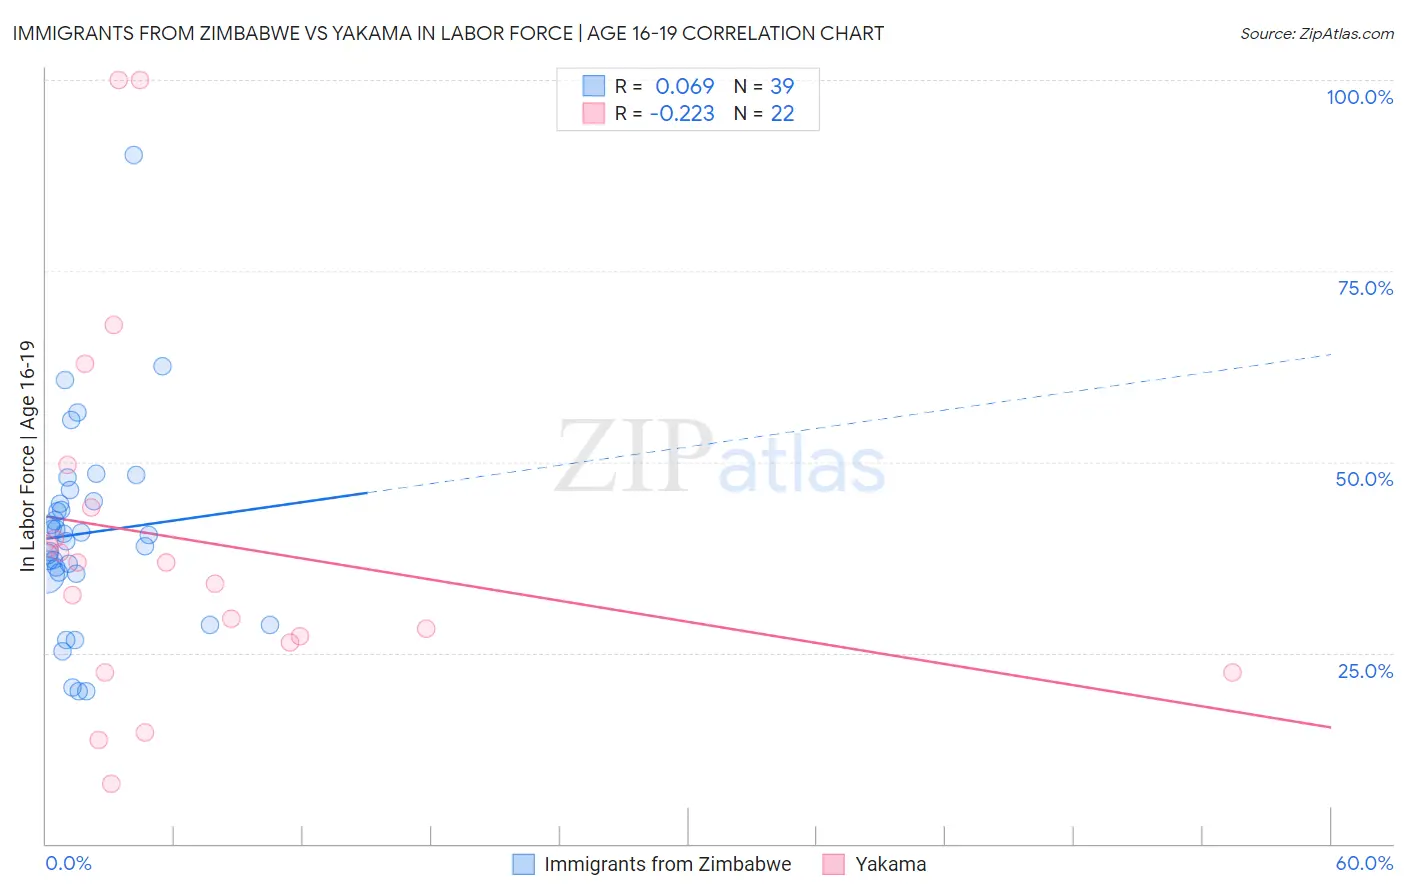
Immigrants from Zimbabwe vs Yakama In Labor Force | Age 16-19 Correlation Chart
The statistical analysis conducted on geographies consisting of 117,770,176 people shows a slight positive correlation between the proportion of Immigrants from Zimbabwe and labor force participation rate among population between the ages 16 and 19 in the United States with a correlation coefficient (R) of 0.069 and weighted average of 38.0%. Similarly, the statistical analysis conducted on geographies consisting of 19,894,194 people shows a weak negative correlation between the proportion of Yakama and labor force participation rate among population between the ages 16 and 19 in the United States with a correlation coefficient (R) of -0.223 and weighted average of 36.9%, a difference of 2.9%.
In Labor Force | Age 16-19 Correlation Summary
| Measurement | Immigrants from Zimbabwe | Yakama |
| Minimum | 20.0% | 7.9% |
| Maximum | 90.2% | 100.0% |
| Range | 70.2% | 92.1% |
| Mean | 40.6% | 39.7% |
| Median | 40.4% | 35.4% |
| Interquartile 25% (IQ1) | 35.3% | 26.4% |
| Interquartile 75% (IQ3) | 44.9% | 44.0% |
| Interquartile Range (IQR) | 9.6% | 17.6% |
| Standard Deviation (Sample) | 13.0% | 24.2% |
| Standard Deviation (Population) | 12.8% | 23.7% |
Similar Demographics by In Labor Force | Age 16-19
Demographics Similar to Immigrants from Zimbabwe by In Labor Force | Age 16-19
In terms of in labor force | age 16-19, the demographic groups most similar to Immigrants from Zimbabwe are Spaniard (38.0%, a difference of 0.030%), New Zealander (38.0%, a difference of 0.050%), African (38.0%, a difference of 0.060%), Choctaw (38.0%, a difference of 0.060%), and Immigrants from Austria (37.9%, a difference of 0.090%).
| Demographics | Rating | Rank | In Labor Force | Age 16-19 |
| Seminole | 96.7 /100 | #123 | Exceptional 38.1% |
| Immigrants | England | 96.4 /100 | #124 | Exceptional 38.1% |
| Immigrants | Africa | 96.1 /100 | #125 | Exceptional 38.0% |
| Africans | 95.6 /100 | #126 | Exceptional 38.0% |
| Choctaw | 95.6 /100 | #127 | Exceptional 38.0% |
| New Zealanders | 95.6 /100 | #128 | Exceptional 38.0% |
| Spaniards | 95.5 /100 | #129 | Exceptional 38.0% |
| Immigrants | Zimbabwe | 95.4 /100 | #130 | Exceptional 38.0% |
| Immigrants | Austria | 95.0 /100 | #131 | Exceptional 37.9% |
| Immigrants | Oceania | 94.7 /100 | #132 | Exceptional 37.9% |
| Cheyenne | 94.6 /100 | #133 | Exceptional 37.9% |
| Immigrants | Netherlands | 93.7 /100 | #134 | Exceptional 37.8% |
| Macedonians | 93.4 /100 | #135 | Exceptional 37.8% |
| Australians | 93.2 /100 | #136 | Exceptional 37.8% |
| Cajuns | 93.2 /100 | #137 | Exceptional 37.8% |
Demographics Similar to Yakama by In Labor Force | Age 16-19
In terms of in labor force | age 16-19, the demographic groups most similar to Yakama are Immigrants from Western Africa (36.9%, a difference of 0.010%), Immigrants from Kuwait (36.9%, a difference of 0.11%), Bermudan (36.9%, a difference of 0.14%), Immigrants from Jordan (36.9%, a difference of 0.15%), and Arab (36.8%, a difference of 0.18%).
| Demographics | Rating | Rank | In Labor Force | Age 16-19 |
| Ute | 75.7 /100 | #158 | Good 37.1% |
| Yaqui | 74.4 /100 | #159 | Good 37.1% |
| Immigrants | Saudi Arabia | 73.9 /100 | #160 | Good 37.0% |
| Cambodians | 71.5 /100 | #161 | Good 37.0% |
| Immigrants | Jordan | 69.5 /100 | #162 | Good 36.9% |
| Bermudans | 69.3 /100 | #163 | Good 36.9% |
| Immigrants | Kuwait | 68.9 /100 | #164 | Good 36.9% |
| Yakama | 66.9 /100 | #165 | Good 36.9% |
| Immigrants | Western Africa | 66.7 /100 | #166 | Good 36.9% |
| Arabs | 63.6 /100 | #167 | Good 36.8% |
| Palestinians | 63.1 /100 | #168 | Good 36.8% |
| Immigrants | Latvia | 61.6 /100 | #169 | Good 36.8% |
| Immigrants | South Africa | 60.5 /100 | #170 | Good 36.8% |
| Immigrants | Cambodia | 58.4 /100 | #171 | Average 36.7% |
| South Africans | 58.3 /100 | #172 | Average 36.7% |