Immigrants from England vs Afghan In Labor Force | Age 16-19
COMPARE
Immigrants from England
Afghan
In Labor Force | Age 16-19
In Labor Force | Age 16-19 Comparison
Immigrants from England
Afghans
38.1%
IN LABOR FORCE | AGE 16-19
96.4/ 100
METRIC RATING
124th/ 347
METRIC RANK
36.1%
IN LABOR FORCE | AGE 16-19
25.7/ 100
METRIC RATING
192nd/ 347
METRIC RANK
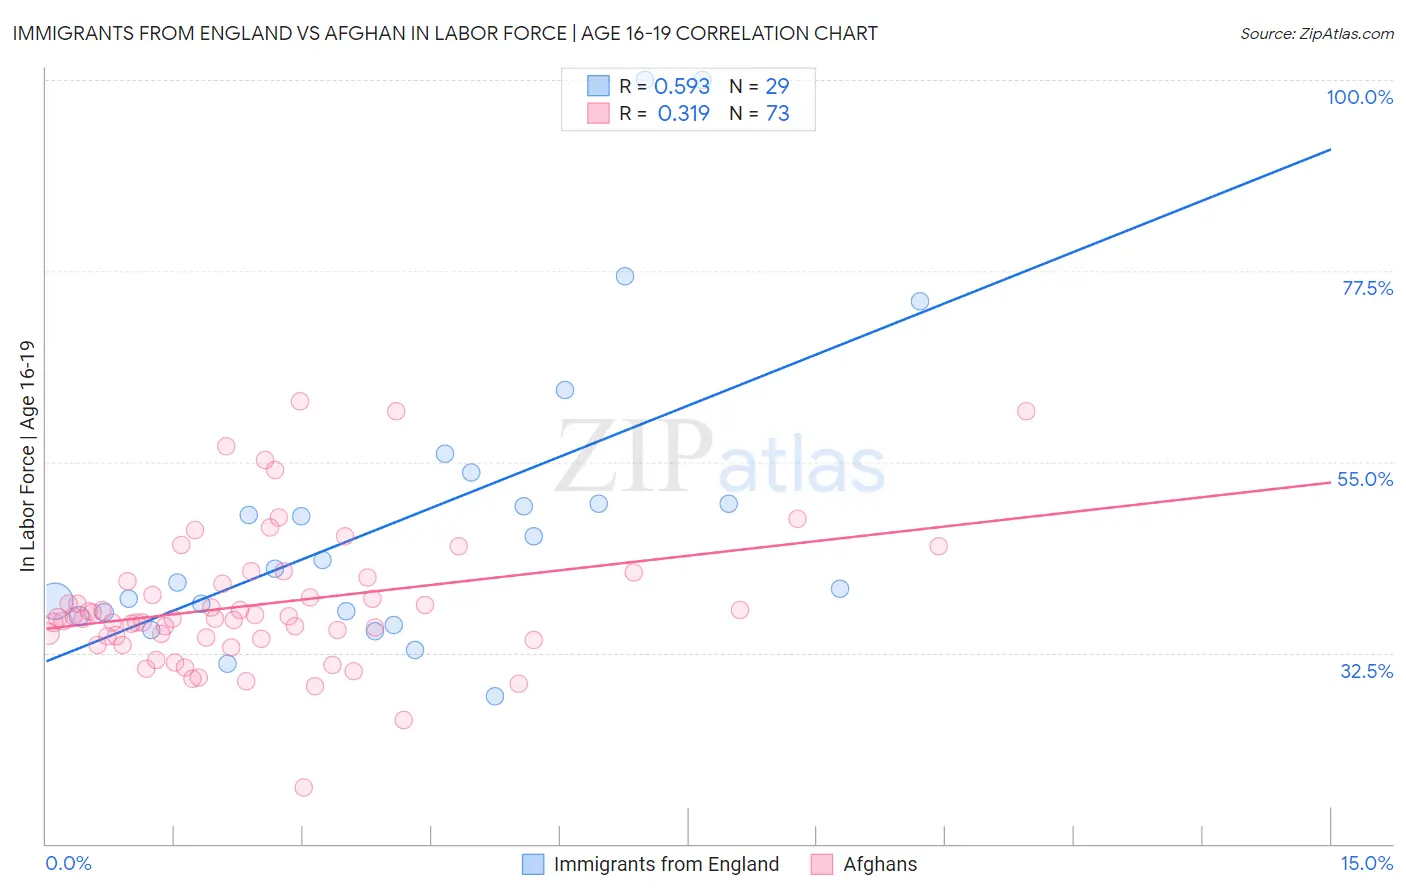
Immigrants from England vs Afghan In Labor Force | Age 16-19 Correlation Chart
The statistical analysis conducted on geographies consisting of 391,103,684 people shows a substantial positive correlation between the proportion of Immigrants from England and labor force participation rate among population between the ages 16 and 19 in the United States with a correlation coefficient (R) of 0.593 and weighted average of 38.1%. Similarly, the statistical analysis conducted on geographies consisting of 148,830,842 people shows a mild positive correlation between the proportion of Afghans and labor force participation rate among population between the ages 16 and 19 in the United States with a correlation coefficient (R) of 0.319 and weighted average of 36.1%, a difference of 5.6%.
In Labor Force | Age 16-19 Correlation Summary
| Measurement | Immigrants from England | Afghan |
| Minimum | 27.4% | 16.7% |
| Maximum | 100.0% | 62.2% |
| Range | 72.6% | 45.5% |
| Mean | 48.6% | 38.3% |
| Median | 42.5% | 36.5% |
| Interquartile 25% (IQ1) | 37.1% | 34.2% |
| Interquartile 75% (IQ3) | 51.9% | 41.1% |
| Interquartile Range (IQR) | 14.8% | 6.9% |
| Standard Deviation (Sample) | 18.4% | 8.1% |
| Standard Deviation (Population) | 18.1% | 8.1% |
Similar Demographics by In Labor Force | Age 16-19
Demographics Similar to Immigrants from England by In Labor Force | Age 16-19
In terms of in labor force | age 16-19, the demographic groups most similar to Immigrants from England are Seminole (38.1%, a difference of 0.080%), Immigrants from Africa (38.0%, a difference of 0.10%), African (38.0%, a difference of 0.26%), Choctaw (38.0%, a difference of 0.27%), and New Zealander (38.0%, a difference of 0.27%).
| Demographics | Rating | Rank | In Labor Force | Age 16-19 |
| Chickasaw | 97.8 /100 | #117 | Exceptional 38.3% |
| Immigrants | Nepal | 97.8 /100 | #118 | Exceptional 38.3% |
| Assyrians/Chaldeans/Syriacs | 97.8 /100 | #119 | Exceptional 38.3% |
| Ukrainians | 97.6 /100 | #120 | Exceptional 38.3% |
| Ethiopians | 97.4 /100 | #121 | Exceptional 38.2% |
| Guamanians/Chamorros | 97.4 /100 | #122 | Exceptional 38.2% |
| Seminole | 96.7 /100 | #123 | Exceptional 38.1% |
| Immigrants | England | 96.4 /100 | #124 | Exceptional 38.1% |
| Immigrants | Africa | 96.1 /100 | #125 | Exceptional 38.0% |
| Africans | 95.6 /100 | #126 | Exceptional 38.0% |
| Choctaw | 95.6 /100 | #127 | Exceptional 38.0% |
| New Zealanders | 95.6 /100 | #128 | Exceptional 38.0% |
| Spaniards | 95.5 /100 | #129 | Exceptional 38.0% |
| Immigrants | Zimbabwe | 95.4 /100 | #130 | Exceptional 38.0% |
| Immigrants | Austria | 95.0 /100 | #131 | Exceptional 37.9% |
Demographics Similar to Afghans by In Labor Force | Age 16-19
In terms of in labor force | age 16-19, the demographic groups most similar to Afghans are Immigrants from Denmark (36.1%, a difference of 0.040%), Nigerian (36.1%, a difference of 0.070%), Immigrants from Croatia (36.1%, a difference of 0.12%), Bolivian (36.0%, a difference of 0.16%), and Panamanian (36.1%, a difference of 0.19%).
| Demographics | Rating | Rank | In Labor Force | Age 16-19 |
| Bhutanese | 35.3 /100 | #185 | Fair 36.3% |
| Immigrants | Romania | 34.0 /100 | #186 | Fair 36.3% |
| Immigrants | Afghanistan | 34.0 /100 | #187 | Fair 36.3% |
| Immigrants | Europe | 31.8 /100 | #188 | Fair 36.2% |
| Immigrants | Hungary | 28.8 /100 | #189 | Fair 36.2% |
| Panamanians | 28.6 /100 | #190 | Fair 36.1% |
| Immigrants | Croatia | 27.5 /100 | #191 | Fair 36.1% |
| Afghans | 25.7 /100 | #192 | Fair 36.1% |
| Immigrants | Denmark | 25.0 /100 | #193 | Fair 36.1% |
| Nigerians | 24.6 /100 | #194 | Fair 36.1% |
| Bolivians | 23.3 /100 | #195 | Fair 36.0% |
| Mexican American Indians | 21.1 /100 | #196 | Fair 36.0% |
| Immigrants | Serbia | 21.0 /100 | #197 | Fair 36.0% |
| Immigrants | Northern Africa | 19.9 /100 | #198 | Poor 35.9% |
| Immigrants | Norway | 19.8 /100 | #199 | Poor 35.9% |