Blackfeet vs Yakama In Labor Force | Age 16-19
COMPARE
Blackfeet
Yakama
In Labor Force | Age 16-19
In Labor Force | Age 16-19 Comparison
Blackfeet
Yakama
38.9%
IN LABOR FORCE | AGE 16-19
99.4/ 100
METRIC RATING
93rd/ 347
METRIC RANK
36.9%
IN LABOR FORCE | AGE 16-19
66.9/ 100
METRIC RATING
165th/ 347
METRIC RANK
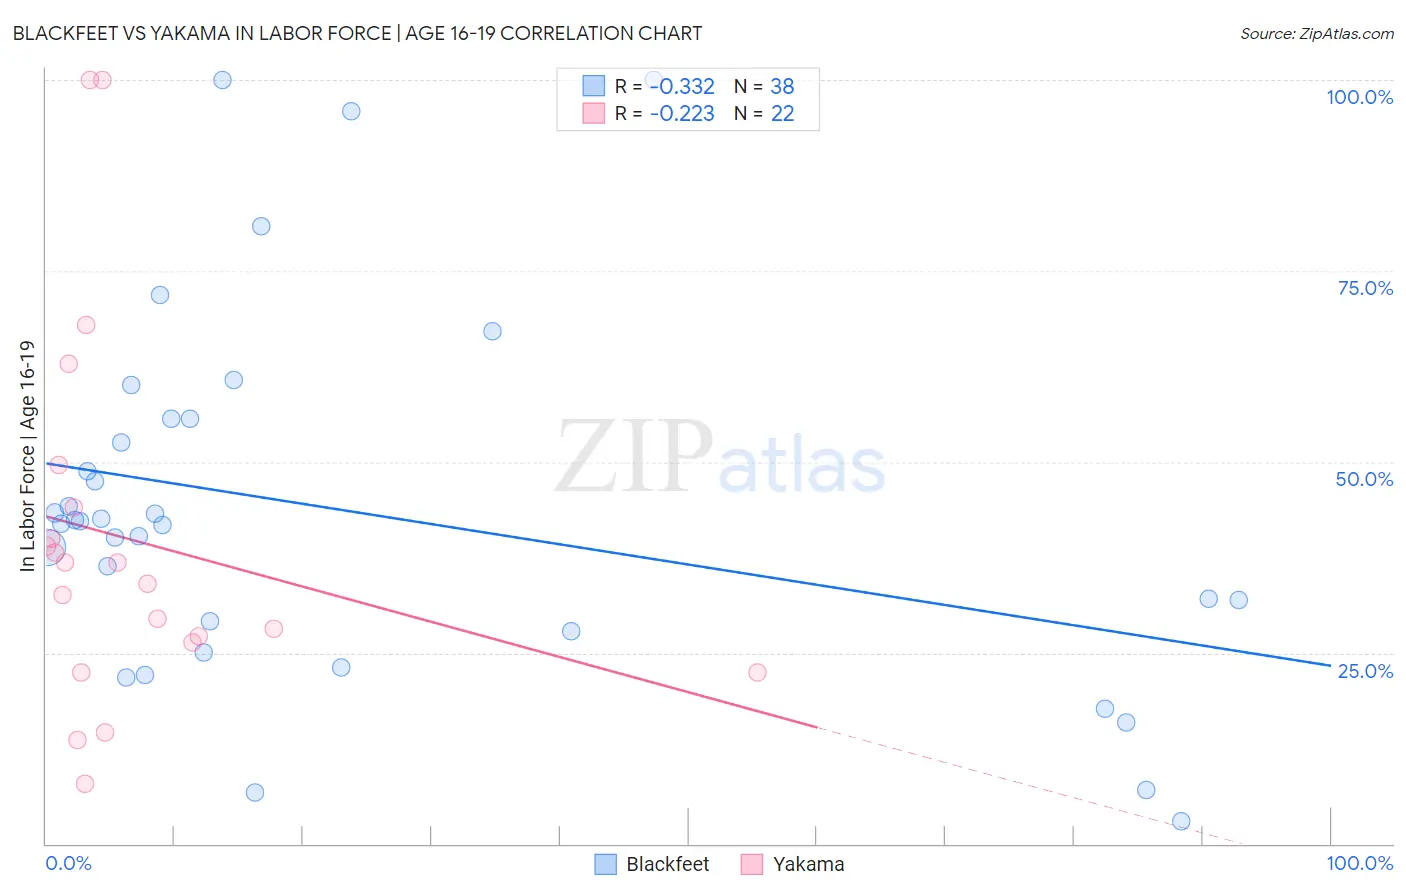
Blackfeet vs Yakama In Labor Force | Age 16-19 Correlation Chart
The statistical analysis conducted on geographies consisting of 309,138,575 people shows a mild negative correlation between the proportion of Blackfeet and labor force participation rate among population between the ages 16 and 19 in the United States with a correlation coefficient (R) of -0.332 and weighted average of 38.9%. Similarly, the statistical analysis conducted on geographies consisting of 19,894,194 people shows a weak negative correlation between the proportion of Yakama and labor force participation rate among population between the ages 16 and 19 in the United States with a correlation coefficient (R) of -0.223 and weighted average of 36.9%, a difference of 5.5%.
In Labor Force | Age 16-19 Correlation Summary
| Measurement | Blackfeet | Yakama |
| Minimum | 2.9% | 7.9% |
| Maximum | 100.0% | 100.0% |
| Range | 97.1% | 92.1% |
| Mean | 43.6% | 39.7% |
| Median | 42.1% | 35.4% |
| Interquartile 25% (IQ1) | 27.8% | 26.4% |
| Interquartile 75% (IQ3) | 55.7% | 44.0% |
| Interquartile Range (IQR) | 27.9% | 17.6% |
| Standard Deviation (Sample) | 23.9% | 24.2% |
| Standard Deviation (Population) | 23.6% | 23.7% |
Similar Demographics by In Labor Force | Age 16-19
Demographics Similar to Blackfeet by In Labor Force | Age 16-19
In terms of in labor force | age 16-19, the demographic groups most similar to Blackfeet are Immigrants from Canada (38.9%, a difference of 0.010%), Osage (39.0%, a difference of 0.060%), Immigrants from North America (38.9%, a difference of 0.090%), Latvian (38.9%, a difference of 0.13%), and Spanish American (39.0%, a difference of 0.15%).
| Demographics | Rating | Rank | In Labor Force | Age 16-19 |
| Samoans | 99.6 /100 | #86 | Exceptional 39.1% |
| Immigrants | Germany | 99.6 /100 | #87 | Exceptional 39.1% |
| Puget Sound Salish | 99.6 /100 | #88 | Exceptional 39.1% |
| Alaska Natives | 99.6 /100 | #89 | Exceptional 39.1% |
| Immigrants | Burma/Myanmar | 99.5 /100 | #90 | Exceptional 39.0% |
| Spanish Americans | 99.5 /100 | #91 | Exceptional 39.0% |
| Osage | 99.4 /100 | #92 | Exceptional 39.0% |
| Blackfeet | 99.4 /100 | #93 | Exceptional 38.9% |
| Immigrants | Canada | 99.4 /100 | #94 | Exceptional 38.9% |
| Immigrants | North America | 99.4 /100 | #95 | Exceptional 38.9% |
| Latvians | 99.4 /100 | #96 | Exceptional 38.9% |
| Greeks | 99.3 /100 | #97 | Exceptional 38.9% |
| Ugandans | 99.3 /100 | #98 | Exceptional 38.9% |
| Immigrants | North Macedonia | 99.3 /100 | #99 | Exceptional 38.9% |
| Immigrants | Thailand | 99.1 /100 | #100 | Exceptional 38.7% |
Demographics Similar to Yakama by In Labor Force | Age 16-19
In terms of in labor force | age 16-19, the demographic groups most similar to Yakama are Immigrants from Western Africa (36.9%, a difference of 0.010%), Immigrants from Kuwait (36.9%, a difference of 0.11%), Bermudan (36.9%, a difference of 0.14%), Immigrants from Jordan (36.9%, a difference of 0.15%), and Arab (36.8%, a difference of 0.18%).
| Demographics | Rating | Rank | In Labor Force | Age 16-19 |
| Ute | 75.7 /100 | #158 | Good 37.1% |
| Yaqui | 74.4 /100 | #159 | Good 37.1% |
| Immigrants | Saudi Arabia | 73.9 /100 | #160 | Good 37.0% |
| Cambodians | 71.5 /100 | #161 | Good 37.0% |
| Immigrants | Jordan | 69.5 /100 | #162 | Good 36.9% |
| Bermudans | 69.3 /100 | #163 | Good 36.9% |
| Immigrants | Kuwait | 68.9 /100 | #164 | Good 36.9% |
| Yakama | 66.9 /100 | #165 | Good 36.9% |
| Immigrants | Western Africa | 66.7 /100 | #166 | Good 36.9% |
| Arabs | 63.6 /100 | #167 | Good 36.8% |
| Palestinians | 63.1 /100 | #168 | Good 36.8% |
| Immigrants | Latvia | 61.6 /100 | #169 | Good 36.8% |
| Immigrants | South Africa | 60.5 /100 | #170 | Good 36.8% |
| Immigrants | Cambodia | 58.4 /100 | #171 | Average 36.7% |
| South Africans | 58.3 /100 | #172 | Average 36.7% |