Immigrants from Cuba vs Seminole In Labor Force | Age 25-29
COMPARE
Immigrants from Cuba
Seminole
In Labor Force | Age 25-29
In Labor Force | Age 25-29 Comparison
Immigrants from Cuba
Seminole
83.2%
IN LABOR FORCE | AGE 25-29
0.0/ 100
METRIC RATING
278th/ 347
METRIC RANK
81.7%
IN LABOR FORCE | AGE 25-29
0.0/ 100
METRIC RATING
319th/ 347
METRIC RANK
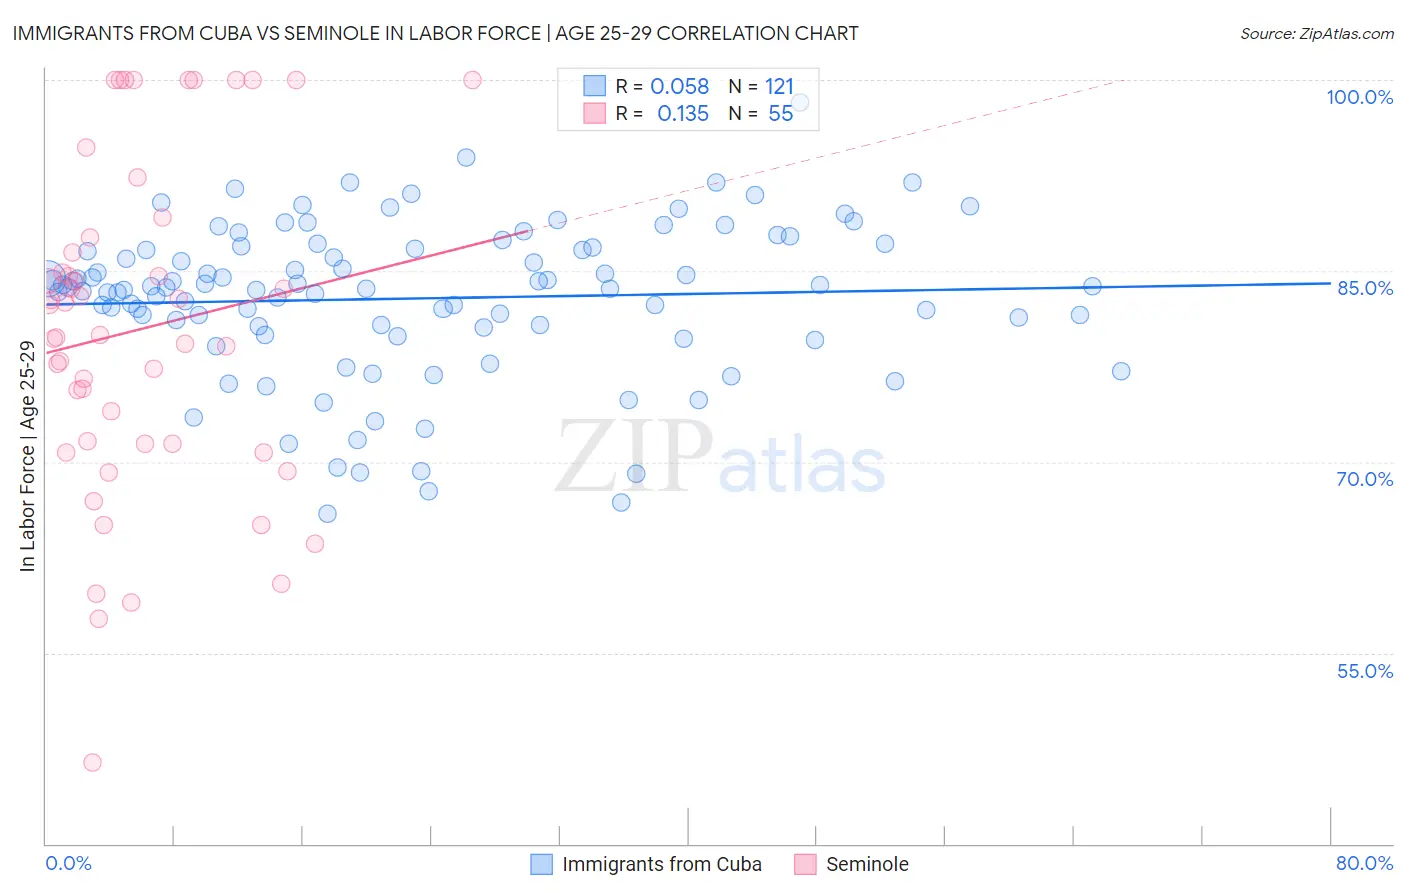
Immigrants from Cuba vs Seminole In Labor Force | Age 25-29 Correlation Chart
The statistical analysis conducted on geographies consisting of 325,905,234 people shows a slight positive correlation between the proportion of Immigrants from Cuba and labor force participation rate among population between the ages 25 and 29 in the United States with a correlation coefficient (R) of 0.058 and weighted average of 83.2%. Similarly, the statistical analysis conducted on geographies consisting of 118,300,906 people shows a poor positive correlation between the proportion of Seminole and labor force participation rate among population between the ages 25 and 29 in the United States with a correlation coefficient (R) of 0.135 and weighted average of 81.7%, a difference of 1.8%.
In Labor Force | Age 25-29 Correlation Summary
| Measurement | Immigrants from Cuba | Seminole |
| Minimum | 65.9% | 46.3% |
| Maximum | 98.2% | 100.0% |
| Range | 32.3% | 53.7% |
| Mean | 82.8% | 80.4% |
| Median | 83.7% | 80.0% |
| Interquartile 25% (IQ1) | 80.6% | 71.4% |
| Interquartile 75% (IQ3) | 86.8% | 87.6% |
| Interquartile Range (IQR) | 6.2% | 16.2% |
| Standard Deviation (Sample) | 6.0% | 13.0% |
| Standard Deviation (Population) | 6.0% | 12.9% |
Similar Demographics by In Labor Force | Age 25-29
Demographics Similar to Immigrants from Cuba by In Labor Force | Age 25-29
In terms of in labor force | age 25-29, the demographic groups most similar to Immigrants from Cuba are British West Indian (83.2%, a difference of 0.010%), Dominican (83.2%, a difference of 0.030%), African (83.2%, a difference of 0.050%), Immigrants from Dominican Republic (83.1%, a difference of 0.090%), and American (83.1%, a difference of 0.10%).
| Demographics | Rating | Rank | In Labor Force | Age 25-29 |
| Hondurans | 0.0 /100 | #271 | Tragic 83.4% |
| Immigrants | Caribbean | 0.0 /100 | #272 | Tragic 83.4% |
| Immigrants | Dominica | 0.0 /100 | #273 | Tragic 83.4% |
| Marshallese | 0.0 /100 | #274 | Tragic 83.3% |
| Samoans | 0.0 /100 | #275 | Tragic 83.3% |
| Immigrants | Honduras | 0.0 /100 | #276 | Tragic 83.3% |
| Africans | 0.0 /100 | #277 | Tragic 83.2% |
| Immigrants | Cuba | 0.0 /100 | #278 | Tragic 83.2% |
| British West Indians | 0.0 /100 | #279 | Tragic 83.2% |
| Dominicans | 0.0 /100 | #280 | Tragic 83.2% |
| Immigrants | Dominican Republic | 0.0 /100 | #281 | Tragic 83.1% |
| Americans | 0.0 /100 | #282 | Tragic 83.1% |
| Immigrants | Azores | 0.0 /100 | #283 | Tragic 83.1% |
| Nicaraguans | 0.0 /100 | #284 | Tragic 83.1% |
| Belizeans | 0.0 /100 | #285 | Tragic 83.1% |
Demographics Similar to Seminole by In Labor Force | Age 25-29
In terms of in labor force | age 25-29, the demographic groups most similar to Seminole are Colville (81.6%, a difference of 0.050%), Shoshone (81.6%, a difference of 0.11%), Kiowa (81.6%, a difference of 0.12%), Alaska Native (81.6%, a difference of 0.16%), and Comanche (81.9%, a difference of 0.22%).
| Demographics | Rating | Rank | In Labor Force | Age 25-29 |
| Hispanics or Latinos | 0.0 /100 | #312 | Tragic 82.2% |
| Yaqui | 0.0 /100 | #313 | Tragic 82.2% |
| Cherokee | 0.0 /100 | #314 | Tragic 82.1% |
| Immigrants | Mexico | 0.0 /100 | #315 | Tragic 82.0% |
| Mexicans | 0.0 /100 | #316 | Tragic 81.9% |
| Chickasaw | 0.0 /100 | #317 | Tragic 81.9% |
| Comanche | 0.0 /100 | #318 | Tragic 81.9% |
| Seminole | 0.0 /100 | #319 | Tragic 81.7% |
| Colville | 0.0 /100 | #320 | Tragic 81.6% |
| Shoshone | 0.0 /100 | #321 | Tragic 81.6% |
| Kiowa | 0.0 /100 | #322 | Tragic 81.6% |
| Alaska Natives | 0.0 /100 | #323 | Tragic 81.6% |
| Houma | 0.0 /100 | #324 | Tragic 81.2% |
| Dutch West Indians | 0.0 /100 | #325 | Tragic 81.1% |
| Choctaw | 0.0 /100 | #326 | Tragic 81.0% |