Immigrants from Cuba vs Immigrants from Serbia In Labor Force | Age 25-29
COMPARE
Immigrants from Cuba
Immigrants from Serbia
In Labor Force | Age 25-29
In Labor Force | Age 25-29 Comparison
Immigrants from Cuba
Immigrants from Serbia
83.2%
IN LABOR FORCE | AGE 25-29
0.0/ 100
METRIC RATING
278th/ 347
METRIC RANK
85.9%
IN LABOR FORCE | AGE 25-29
100.0/ 100
METRIC RATING
30th/ 347
METRIC RANK
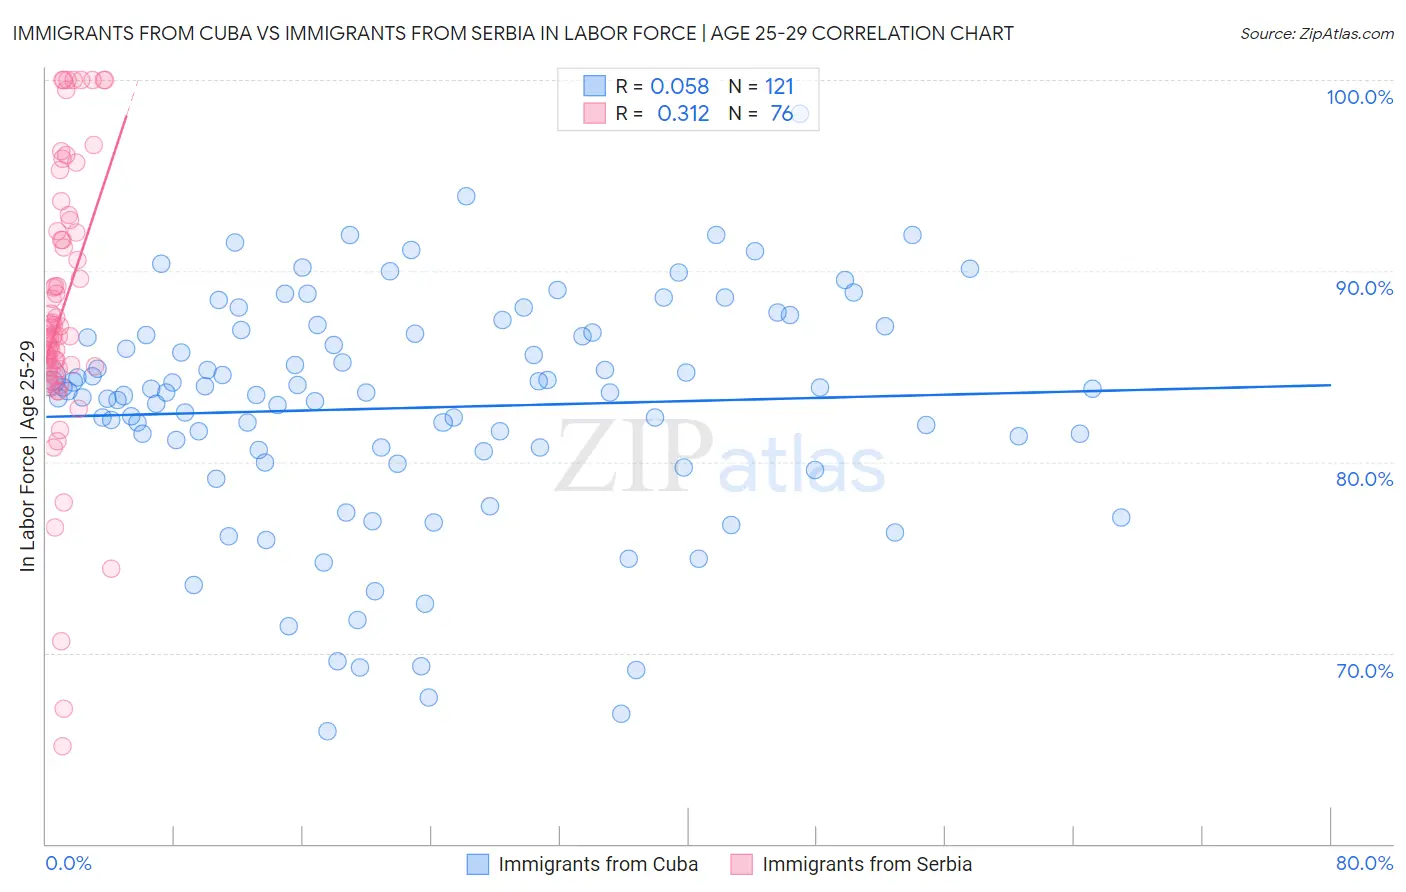
Immigrants from Cuba vs Immigrants from Serbia In Labor Force | Age 25-29 Correlation Chart
The statistical analysis conducted on geographies consisting of 325,905,234 people shows a slight positive correlation between the proportion of Immigrants from Cuba and labor force participation rate among population between the ages 25 and 29 in the United States with a correlation coefficient (R) of 0.058 and weighted average of 83.2%. Similarly, the statistical analysis conducted on geographies consisting of 131,726,822 people shows a mild positive correlation between the proportion of Immigrants from Serbia and labor force participation rate among population between the ages 25 and 29 in the United States with a correlation coefficient (R) of 0.312 and weighted average of 85.9%, a difference of 3.2%.
In Labor Force | Age 25-29 Correlation Summary
| Measurement | Immigrants from Cuba | Immigrants from Serbia |
| Minimum | 65.9% | 65.1% |
| Maximum | 98.2% | 100.0% |
| Range | 32.3% | 34.9% |
| Mean | 82.8% | 87.9% |
| Median | 83.7% | 86.6% |
| Interquartile 25% (IQ1) | 80.6% | 84.9% |
| Interquartile 75% (IQ3) | 86.8% | 92.0% |
| Interquartile Range (IQR) | 6.2% | 7.1% |
| Standard Deviation (Sample) | 6.0% | 7.2% |
| Standard Deviation (Population) | 6.0% | 7.2% |
Similar Demographics by In Labor Force | Age 25-29
Demographics Similar to Immigrants from Cuba by In Labor Force | Age 25-29
In terms of in labor force | age 25-29, the demographic groups most similar to Immigrants from Cuba are British West Indian (83.2%, a difference of 0.010%), Dominican (83.2%, a difference of 0.030%), African (83.2%, a difference of 0.050%), Immigrants from Dominican Republic (83.1%, a difference of 0.090%), and American (83.1%, a difference of 0.10%).
| Demographics | Rating | Rank | In Labor Force | Age 25-29 |
| Hondurans | 0.0 /100 | #271 | Tragic 83.4% |
| Immigrants | Caribbean | 0.0 /100 | #272 | Tragic 83.4% |
| Immigrants | Dominica | 0.0 /100 | #273 | Tragic 83.4% |
| Marshallese | 0.0 /100 | #274 | Tragic 83.3% |
| Samoans | 0.0 /100 | #275 | Tragic 83.3% |
| Immigrants | Honduras | 0.0 /100 | #276 | Tragic 83.3% |
| Africans | 0.0 /100 | #277 | Tragic 83.2% |
| Immigrants | Cuba | 0.0 /100 | #278 | Tragic 83.2% |
| British West Indians | 0.0 /100 | #279 | Tragic 83.2% |
| Dominicans | 0.0 /100 | #280 | Tragic 83.2% |
| Immigrants | Dominican Republic | 0.0 /100 | #281 | Tragic 83.1% |
| Americans | 0.0 /100 | #282 | Tragic 83.1% |
| Immigrants | Azores | 0.0 /100 | #283 | Tragic 83.1% |
| Nicaraguans | 0.0 /100 | #284 | Tragic 83.1% |
| Belizeans | 0.0 /100 | #285 | Tragic 83.1% |
Demographics Similar to Immigrants from Serbia by In Labor Force | Age 25-29
In terms of in labor force | age 25-29, the demographic groups most similar to Immigrants from Serbia are German Russian (85.8%, a difference of 0.010%), Slovak (85.8%, a difference of 0.010%), Immigrants from Bulgaria (85.8%, a difference of 0.020%), Ugandan (85.9%, a difference of 0.040%), and Immigrants from Liberia (85.9%, a difference of 0.040%).
| Demographics | Rating | Rank | In Labor Force | Age 25-29 |
| Immigrants | Uganda | 100.0 /100 | #23 | Exceptional 86.0% |
| Immigrants | Eastern Africa | 100.0 /100 | #24 | Exceptional 86.0% |
| Sudanese | 100.0 /100 | #25 | Exceptional 85.9% |
| Immigrants | North Macedonia | 100.0 /100 | #26 | Exceptional 85.9% |
| Paraguayans | 100.0 /100 | #27 | Exceptional 85.9% |
| Ugandans | 100.0 /100 | #28 | Exceptional 85.9% |
| Immigrants | Liberia | 100.0 /100 | #29 | Exceptional 85.9% |
| Immigrants | Serbia | 100.0 /100 | #30 | Exceptional 85.9% |
| German Russians | 100.0 /100 | #31 | Exceptional 85.8% |
| Slovaks | 100.0 /100 | #32 | Exceptional 85.8% |
| Immigrants | Bulgaria | 100.0 /100 | #33 | Exceptional 85.8% |
| Lithuanians | 99.9 /100 | #34 | Exceptional 85.8% |
| Cypriots | 99.9 /100 | #35 | Exceptional 85.8% |
| Immigrants | Nepal | 99.9 /100 | #36 | Exceptional 85.8% |
| Poles | 99.9 /100 | #37 | Exceptional 85.8% |