Soviet Union vs Seminole In Labor Force | Age 25-29
COMPARE
Soviet Union
Seminole
In Labor Force | Age 25-29
In Labor Force | Age 25-29 Comparison
Soviet Union
Seminole
85.3%
IN LABOR FORCE | AGE 25-29
98.5/ 100
METRIC RATING
74th/ 347
METRIC RANK
81.7%
IN LABOR FORCE | AGE 25-29
0.0/ 100
METRIC RATING
319th/ 347
METRIC RANK
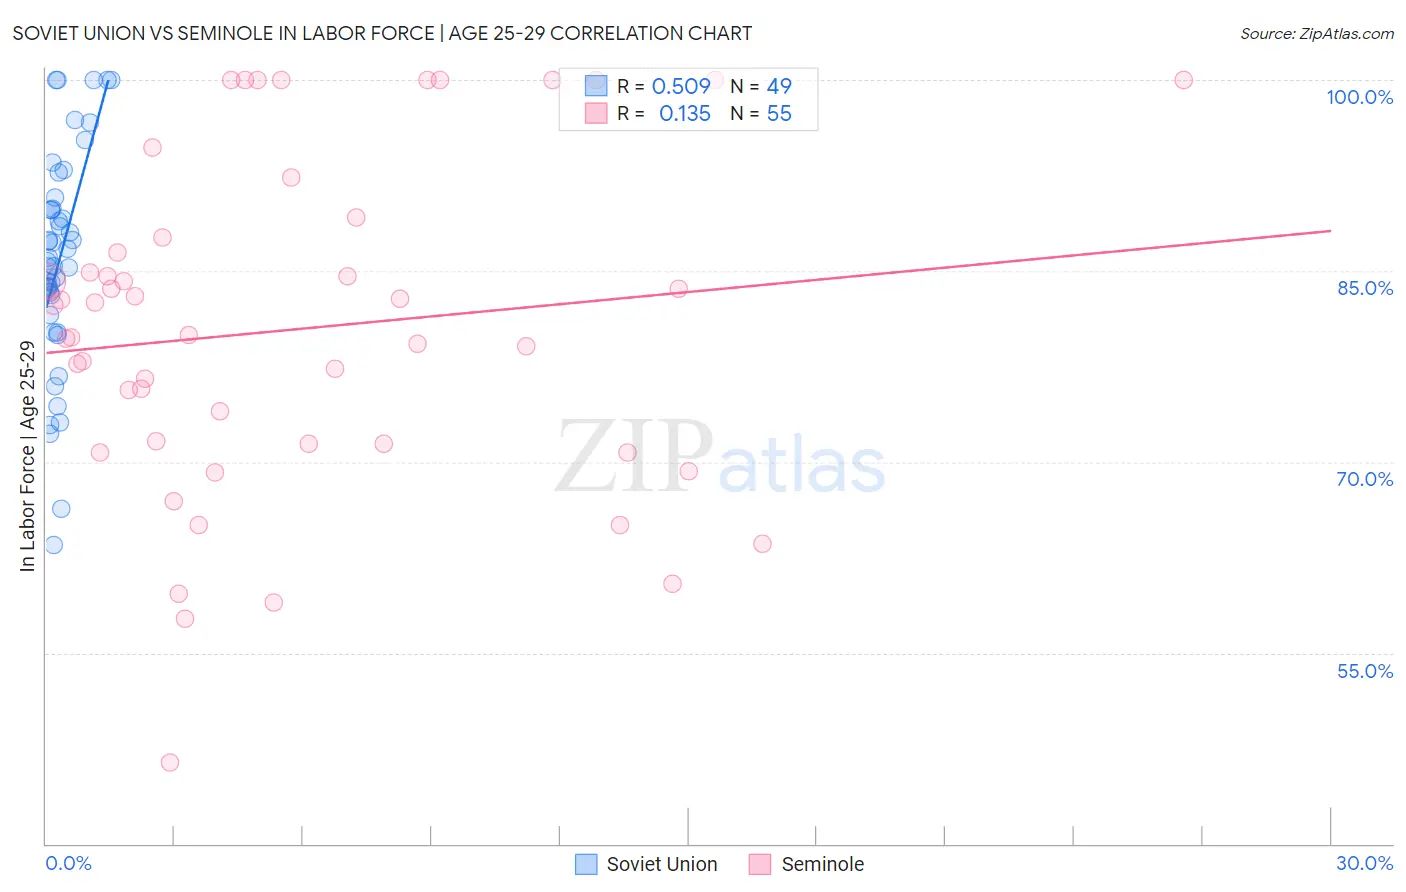
Soviet Union vs Seminole In Labor Force | Age 25-29 Correlation Chart
The statistical analysis conducted on geographies consisting of 43,504,224 people shows a substantial positive correlation between the proportion of Soviet Union and labor force participation rate among population between the ages 25 and 29 in the United States with a correlation coefficient (R) of 0.509 and weighted average of 85.3%. Similarly, the statistical analysis conducted on geographies consisting of 118,300,906 people shows a poor positive correlation between the proportion of Seminole and labor force participation rate among population between the ages 25 and 29 in the United States with a correlation coefficient (R) of 0.135 and weighted average of 81.7%, a difference of 4.4%.
In Labor Force | Age 25-29 Correlation Summary
| Measurement | Soviet Union | Seminole |
| Minimum | 63.5% | 46.3% |
| Maximum | 100.0% | 100.0% |
| Range | 36.5% | 53.7% |
| Mean | 86.0% | 80.4% |
| Median | 86.1% | 80.0% |
| Interquartile 25% (IQ1) | 82.3% | 71.4% |
| Interquartile 75% (IQ3) | 90.3% | 87.6% |
| Interquartile Range (IQR) | 8.0% | 16.2% |
| Standard Deviation (Sample) | 8.5% | 13.0% |
| Standard Deviation (Population) | 8.4% | 12.9% |
Similar Demographics by In Labor Force | Age 25-29
Demographics Similar to Soviet Union by In Labor Force | Age 25-29
In terms of in labor force | age 25-29, the demographic groups most similar to Soviet Union are Brazilian (85.3%, a difference of 0.030%), Russian (85.3%, a difference of 0.040%), Immigrants from Australia (85.3%, a difference of 0.050%), German (85.3%, a difference of 0.050%), and Kenyan (85.4%, a difference of 0.070%).
| Demographics | Rating | Rank | In Labor Force | Age 25-29 |
| Immigrants | Turkey | 99.2 /100 | #67 | Exceptional 85.4% |
| Immigrants | Cameroon | 99.2 /100 | #68 | Exceptional 85.4% |
| Menominee | 99.1 /100 | #69 | Exceptional 85.4% |
| Immigrants | Sweden | 99.1 /100 | #70 | Exceptional 85.4% |
| Kenyans | 99.0 /100 | #71 | Exceptional 85.4% |
| Immigrants | Australia | 98.9 /100 | #72 | Exceptional 85.3% |
| Russians | 98.8 /100 | #73 | Exceptional 85.3% |
| Soviet Union | 98.5 /100 | #74 | Exceptional 85.3% |
| Brazilians | 98.3 /100 | #75 | Exceptional 85.3% |
| Germans | 98.1 /100 | #76 | Exceptional 85.3% |
| Immigrants | South Central Asia | 97.9 /100 | #77 | Exceptional 85.2% |
| Immigrants | Egypt | 97.7 /100 | #78 | Exceptional 85.2% |
| Immigrants | Northern Africa | 97.6 /100 | #79 | Exceptional 85.2% |
| Immigrants | Zimbabwe | 97.6 /100 | #80 | Exceptional 85.2% |
| Immigrants | Northern Europe | 97.2 /100 | #81 | Exceptional 85.2% |
Demographics Similar to Seminole by In Labor Force | Age 25-29
In terms of in labor force | age 25-29, the demographic groups most similar to Seminole are Colville (81.6%, a difference of 0.050%), Shoshone (81.6%, a difference of 0.11%), Kiowa (81.6%, a difference of 0.12%), Alaska Native (81.6%, a difference of 0.16%), and Comanche (81.9%, a difference of 0.22%).
| Demographics | Rating | Rank | In Labor Force | Age 25-29 |
| Hispanics or Latinos | 0.0 /100 | #312 | Tragic 82.2% |
| Yaqui | 0.0 /100 | #313 | Tragic 82.2% |
| Cherokee | 0.0 /100 | #314 | Tragic 82.1% |
| Immigrants | Mexico | 0.0 /100 | #315 | Tragic 82.0% |
| Mexicans | 0.0 /100 | #316 | Tragic 81.9% |
| Chickasaw | 0.0 /100 | #317 | Tragic 81.9% |
| Comanche | 0.0 /100 | #318 | Tragic 81.9% |
| Seminole | 0.0 /100 | #319 | Tragic 81.7% |
| Colville | 0.0 /100 | #320 | Tragic 81.6% |
| Shoshone | 0.0 /100 | #321 | Tragic 81.6% |
| Kiowa | 0.0 /100 | #322 | Tragic 81.6% |
| Alaska Natives | 0.0 /100 | #323 | Tragic 81.6% |
| Houma | 0.0 /100 | #324 | Tragic 81.2% |
| Dutch West Indians | 0.0 /100 | #325 | Tragic 81.1% |
| Choctaw | 0.0 /100 | #326 | Tragic 81.0% |