Swiss vs Seminole In Labor Force | Age 25-29
COMPARE
Swiss
Seminole
In Labor Force | Age 25-29
In Labor Force | Age 25-29 Comparison
Swiss
Seminole
84.7%
IN LABOR FORCE | AGE 25-29
64.7/ 100
METRIC RATING
150th/ 347
METRIC RANK
81.7%
IN LABOR FORCE | AGE 25-29
0.0/ 100
METRIC RATING
319th/ 347
METRIC RANK
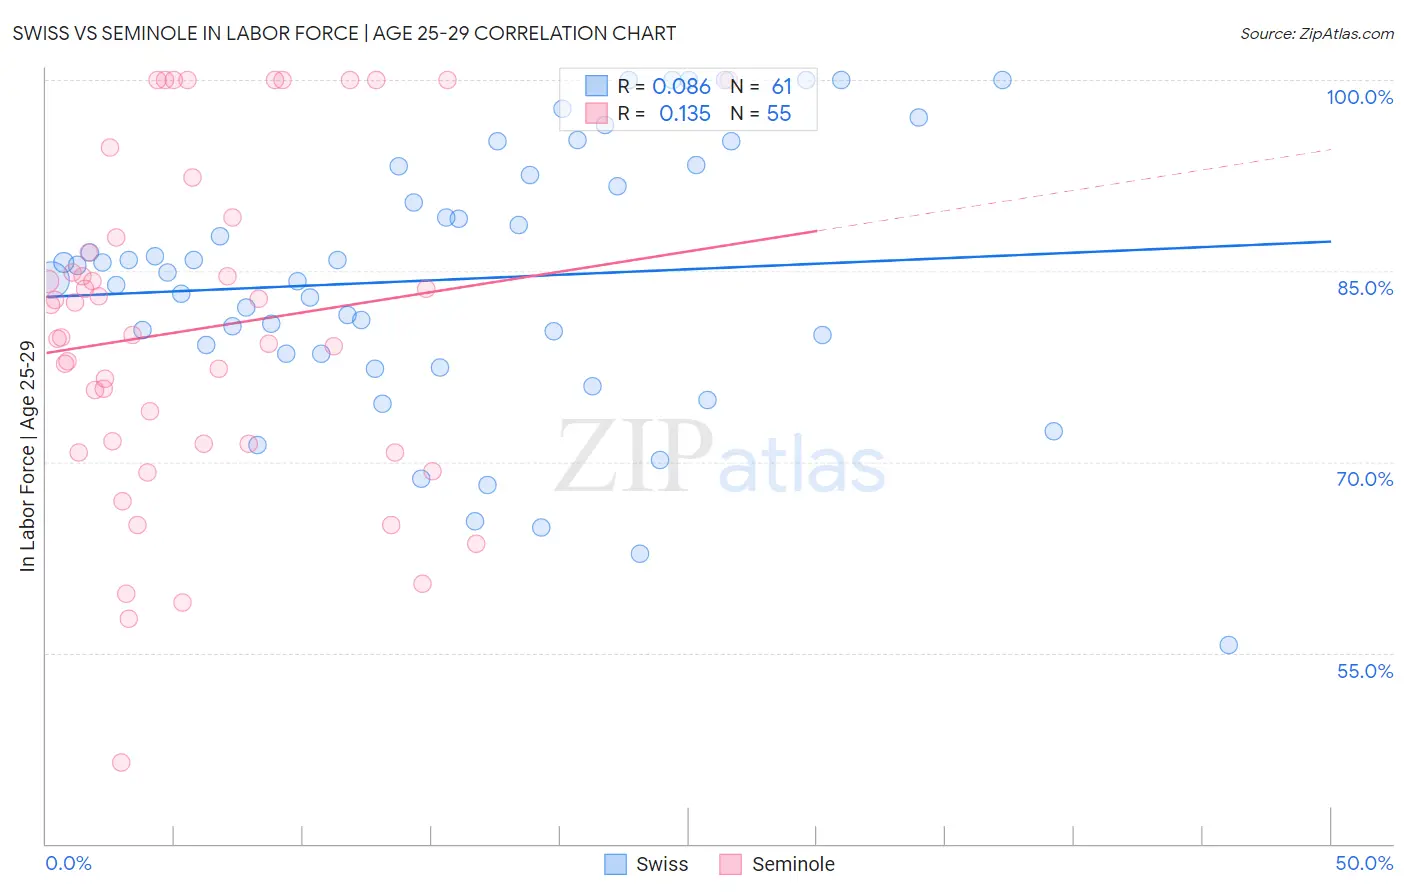
Swiss vs Seminole In Labor Force | Age 25-29 Correlation Chart
The statistical analysis conducted on geographies consisting of 464,613,685 people shows a slight positive correlation between the proportion of Swiss and labor force participation rate among population between the ages 25 and 29 in the United States with a correlation coefficient (R) of 0.086 and weighted average of 84.7%. Similarly, the statistical analysis conducted on geographies consisting of 118,300,906 people shows a poor positive correlation between the proportion of Seminole and labor force participation rate among population between the ages 25 and 29 in the United States with a correlation coefficient (R) of 0.135 and weighted average of 81.7%, a difference of 3.7%.
In Labor Force | Age 25-29 Correlation Summary
| Measurement | Swiss | Seminole |
| Minimum | 55.6% | 46.3% |
| Maximum | 100.0% | 100.0% |
| Range | 44.4% | 53.7% |
| Mean | 84.4% | 80.4% |
| Median | 84.8% | 80.0% |
| Interquartile 25% (IQ1) | 78.5% | 71.4% |
| Interquartile 75% (IQ3) | 92.9% | 87.6% |
| Interquartile Range (IQR) | 14.4% | 16.2% |
| Standard Deviation (Sample) | 10.5% | 13.0% |
| Standard Deviation (Population) | 10.4% | 12.9% |
Similar Demographics by In Labor Force | Age 25-29
Demographics Similar to Swiss by In Labor Force | Age 25-29
In terms of in labor force | age 25-29, the demographic groups most similar to Swiss are Immigrants from England (84.7%, a difference of 0.0%), Peruvian (84.7%, a difference of 0.0%), Colombian (84.7%, a difference of 0.010%), Immigrants from Pakistan (84.7%, a difference of 0.020%), and Immigrants from Taiwan (84.7%, a difference of 0.020%).
| Demographics | Rating | Rank | In Labor Force | Age 25-29 |
| Sri Lankans | 69.2 /100 | #143 | Good 84.8% |
| Immigrants | Laos | 69.0 /100 | #144 | Good 84.8% |
| Immigrants | Senegal | 68.3 /100 | #145 | Good 84.8% |
| Icelanders | 68.2 /100 | #146 | Good 84.8% |
| Immigrants | Asia | 68.2 /100 | #147 | Good 84.8% |
| Immigrants | England | 65.2 /100 | #148 | Good 84.7% |
| Peruvians | 64.7 /100 | #149 | Good 84.7% |
| Swiss | 64.7 /100 | #150 | Good 84.7% |
| Colombians | 62.8 /100 | #151 | Good 84.7% |
| Immigrants | Pakistan | 62.7 /100 | #152 | Good 84.7% |
| Immigrants | Taiwan | 62.2 /100 | #153 | Good 84.7% |
| Immigrants | Sri Lanka | 61.7 /100 | #154 | Good 84.7% |
| Indians (Asian) | 61.6 /100 | #155 | Good 84.7% |
| French | 61.0 /100 | #156 | Good 84.7% |
| British | 60.4 /100 | #157 | Good 84.7% |
Demographics Similar to Seminole by In Labor Force | Age 25-29
In terms of in labor force | age 25-29, the demographic groups most similar to Seminole are Colville (81.6%, a difference of 0.050%), Shoshone (81.6%, a difference of 0.11%), Kiowa (81.6%, a difference of 0.12%), Alaska Native (81.6%, a difference of 0.16%), and Comanche (81.9%, a difference of 0.22%).
| Demographics | Rating | Rank | In Labor Force | Age 25-29 |
| Hispanics or Latinos | 0.0 /100 | #312 | Tragic 82.2% |
| Yaqui | 0.0 /100 | #313 | Tragic 82.2% |
| Cherokee | 0.0 /100 | #314 | Tragic 82.1% |
| Immigrants | Mexico | 0.0 /100 | #315 | Tragic 82.0% |
| Mexicans | 0.0 /100 | #316 | Tragic 81.9% |
| Chickasaw | 0.0 /100 | #317 | Tragic 81.9% |
| Comanche | 0.0 /100 | #318 | Tragic 81.9% |
| Seminole | 0.0 /100 | #319 | Tragic 81.7% |
| Colville | 0.0 /100 | #320 | Tragic 81.6% |
| Shoshone | 0.0 /100 | #321 | Tragic 81.6% |
| Kiowa | 0.0 /100 | #322 | Tragic 81.6% |
| Alaska Natives | 0.0 /100 | #323 | Tragic 81.6% |
| Houma | 0.0 /100 | #324 | Tragic 81.2% |
| Dutch West Indians | 0.0 /100 | #325 | Tragic 81.1% |
| Choctaw | 0.0 /100 | #326 | Tragic 81.0% |