Immigrants from Cuba vs Seminole Professional Degree
COMPARE
Immigrants from Cuba
Seminole
Professional Degree
Professional Degree Comparison
Immigrants from Cuba
Seminole
3.6%
PROFESSIONAL DEGREE
0.6/ 100
METRIC RATING
269th/ 347
METRIC RANK
3.2%
PROFESSIONAL DEGREE
0.1/ 100
METRIC RATING
320th/ 347
METRIC RANK
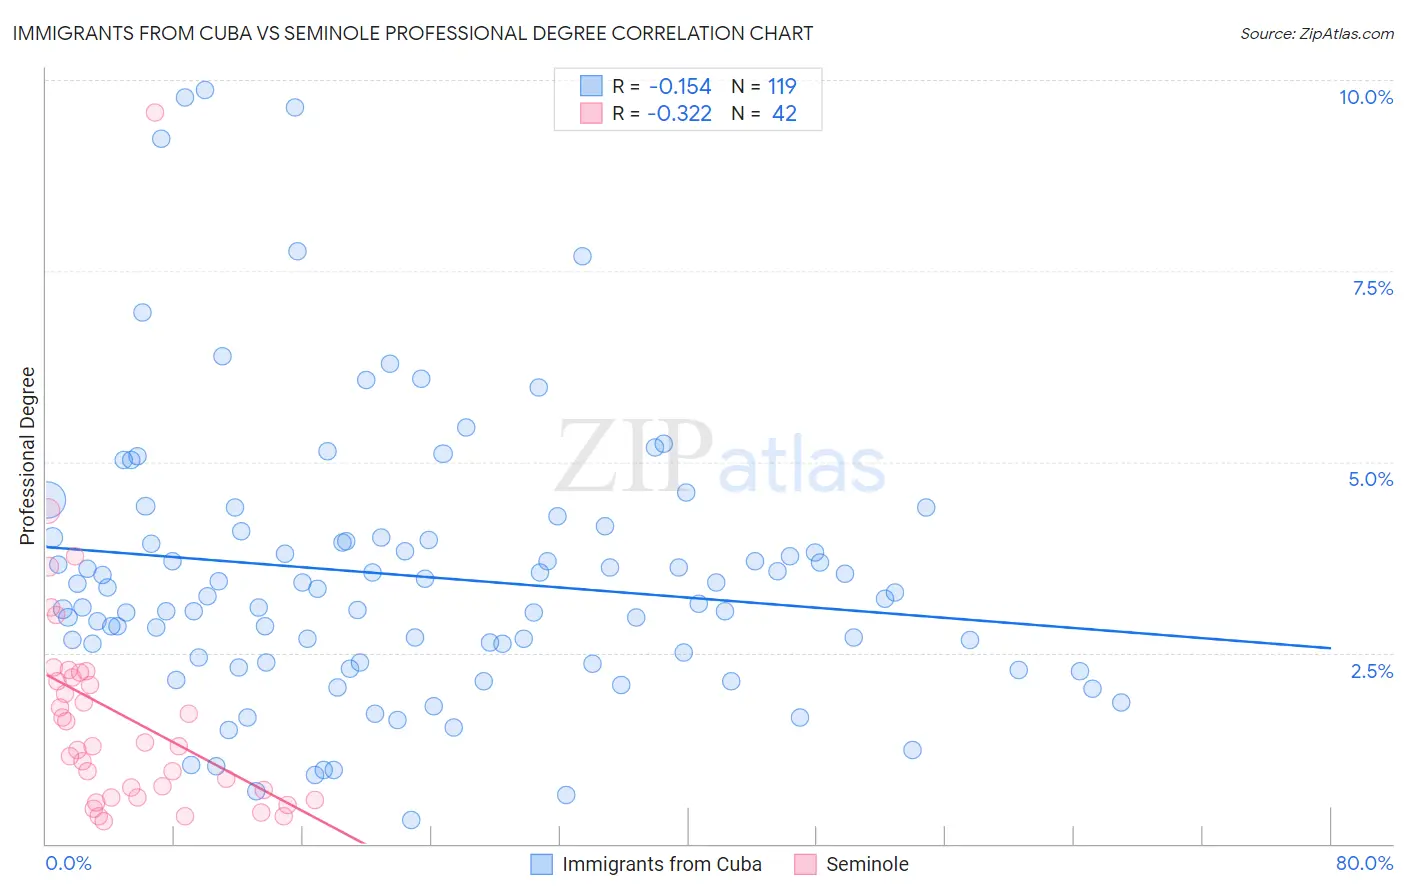
Immigrants from Cuba vs Seminole Professional Degree Correlation Chart
The statistical analysis conducted on geographies consisting of 325,367,242 people shows a poor negative correlation between the proportion of Immigrants from Cuba and percentage of population with at least professional degree education in the United States with a correlation coefficient (R) of -0.154 and weighted average of 3.6%. Similarly, the statistical analysis conducted on geographies consisting of 118,144,737 people shows a mild negative correlation between the proportion of Seminole and percentage of population with at least professional degree education in the United States with a correlation coefficient (R) of -0.322 and weighted average of 3.2%, a difference of 12.6%.
Professional Degree Correlation Summary
| Measurement | Immigrants from Cuba | Seminole |
| Minimum | 0.31% | 0.30% |
| Maximum | 9.9% | 9.6% |
| Range | 9.6% | 9.3% |
| Mean | 3.5% | 1.7% |
| Median | 3.2% | 1.3% |
| Interquartile 25% (IQ1) | 2.4% | 0.61% |
| Interquartile 75% (IQ3) | 4.0% | 2.2% |
| Interquartile Range (IQR) | 1.6% | 1.6% |
| Standard Deviation (Sample) | 1.8% | 1.6% |
| Standard Deviation (Population) | 1.8% | 1.6% |
Similar Demographics by Professional Degree
Demographics Similar to Immigrants from Cuba by Professional Degree
In terms of professional degree, the demographic groups most similar to Immigrants from Cuba are Central American (3.6%, a difference of 0.29%), Aleut (3.6%, a difference of 0.60%), Delaware (3.6%, a difference of 0.75%), Belizean (3.6%, a difference of 0.76%), and Immigrants from Jamaica (3.6%, a difference of 0.78%).
| Demographics | Rating | Rank | Professional Degree |
| U.S. Virgin Islanders | 1.0 /100 | #262 | Tragic 3.7% |
| Hopi | 0.9 /100 | #263 | Tragic 3.6% |
| Immigrants | Cambodia | 0.9 /100 | #264 | Tragic 3.6% |
| Immigrants | Congo | 0.8 /100 | #265 | Tragic 3.6% |
| Central American Indians | 0.8 /100 | #266 | Tragic 3.6% |
| Delaware | 0.7 /100 | #267 | Tragic 3.6% |
| Aleuts | 0.7 /100 | #268 | Tragic 3.6% |
| Immigrants | Cuba | 0.6 /100 | #269 | Tragic 3.6% |
| Central Americans | 0.6 /100 | #270 | Tragic 3.6% |
| Belizeans | 0.5 /100 | #271 | Tragic 3.6% |
| Immigrants | Jamaica | 0.5 /100 | #272 | Tragic 3.6% |
| Americans | 0.5 /100 | #273 | Tragic 3.6% |
| Potawatomi | 0.5 /100 | #274 | Tragic 3.6% |
| Immigrants | Dominica | 0.5 /100 | #275 | Tragic 3.6% |
| Liberians | 0.5 /100 | #276 | Tragic 3.6% |
Demographics Similar to Seminole by Professional Degree
In terms of professional degree, the demographic groups most similar to Seminole are Tsimshian (3.2%, a difference of 0.36%), Hispanic or Latino (3.2%, a difference of 0.72%), Inupiat (3.2%, a difference of 0.80%), Crow (3.2%, a difference of 1.1%), and Choctaw (3.2%, a difference of 1.1%).
| Demographics | Rating | Rank | Professional Degree |
| Yuman | 0.1 /100 | #313 | Tragic 3.3% |
| Mexican American Indians | 0.1 /100 | #314 | Tragic 3.3% |
| Immigrants | Laos | 0.1 /100 | #315 | Tragic 3.2% |
| Puerto Ricans | 0.1 /100 | #316 | Tragic 3.2% |
| Nepalese | 0.1 /100 | #317 | Tragic 3.2% |
| Immigrants | Micronesia | 0.1 /100 | #318 | Tragic 3.2% |
| Choctaw | 0.1 /100 | #319 | Tragic 3.2% |
| Seminole | 0.1 /100 | #320 | Tragic 3.2% |
| Tsimshian | 0.0 /100 | #321 | Tragic 3.2% |
| Hispanics or Latinos | 0.0 /100 | #322 | Tragic 3.2% |
| Inupiat | 0.0 /100 | #323 | Tragic 3.2% |
| Crow | 0.0 /100 | #324 | Tragic 3.2% |
| Yaqui | 0.0 /100 | #325 | Tragic 3.2% |
| Menominee | 0.0 /100 | #326 | Tragic 3.1% |
| Dutch West Indians | 0.0 /100 | #327 | Tragic 3.1% |