Immigrants from Cuba vs American In Labor Force | Age 25-29
COMPARE
Immigrants from Cuba
American
In Labor Force | Age 25-29
In Labor Force | Age 25-29 Comparison
Immigrants from Cuba
Americans
83.2%
IN LABOR FORCE | AGE 25-29
0.0/ 100
METRIC RATING
278th/ 347
METRIC RANK
83.1%
IN LABOR FORCE | AGE 25-29
0.0/ 100
METRIC RATING
282nd/ 347
METRIC RANK
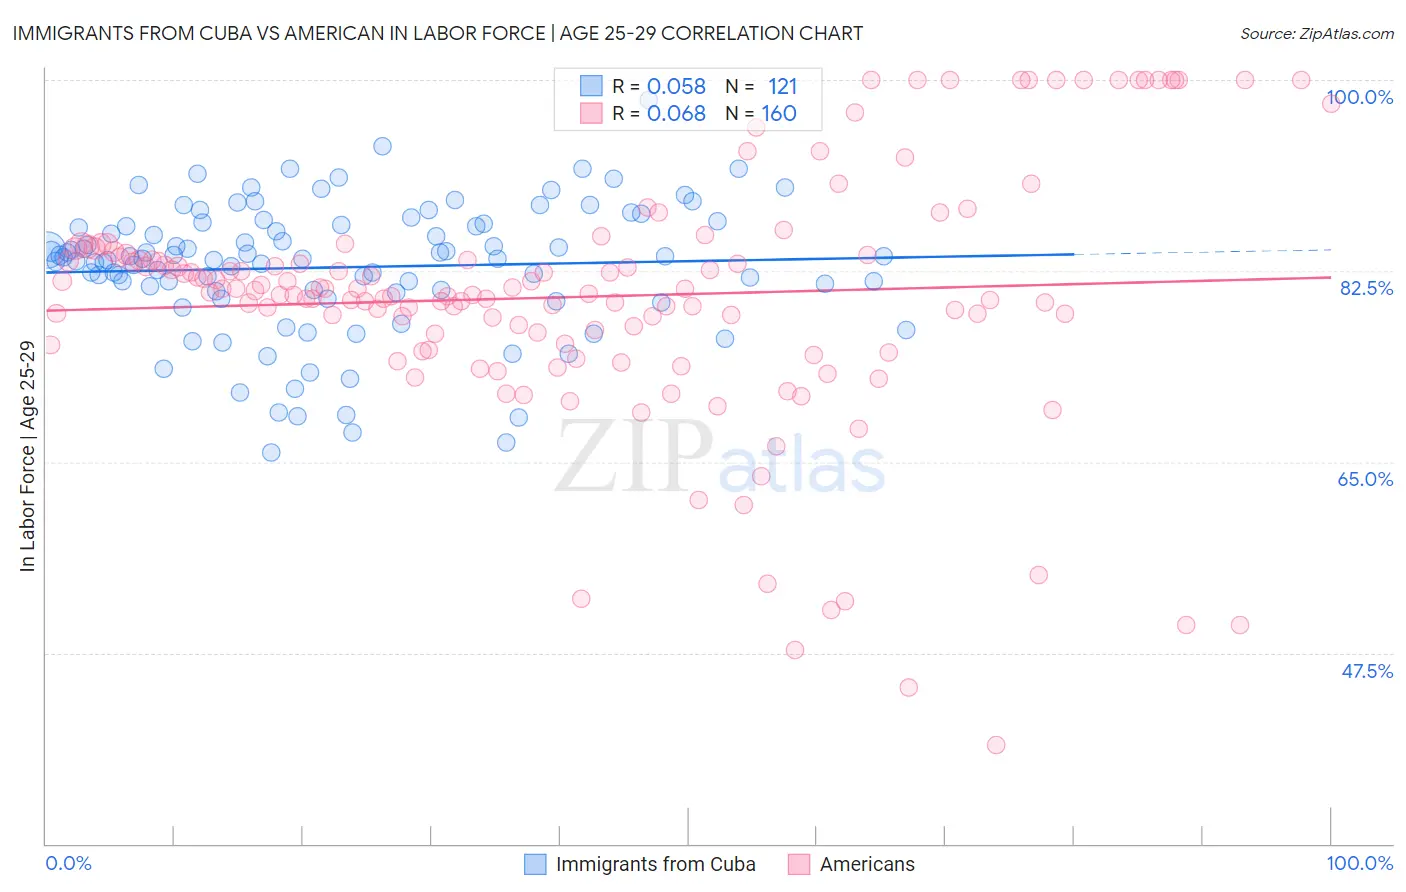
Immigrants from Cuba vs American In Labor Force | Age 25-29 Correlation Chart
The statistical analysis conducted on geographies consisting of 325,905,234 people shows a slight positive correlation between the proportion of Immigrants from Cuba and labor force participation rate among population between the ages 25 and 29 in the United States with a correlation coefficient (R) of 0.058 and weighted average of 83.2%. Similarly, the statistical analysis conducted on geographies consisting of 580,038,437 people shows a slight positive correlation between the proportion of Americans and labor force participation rate among population between the ages 25 and 29 in the United States with a correlation coefficient (R) of 0.068 and weighted average of 83.1%, a difference of 0.10%.
In Labor Force | Age 25-29 Correlation Summary
| Measurement | Immigrants from Cuba | American |
| Minimum | 65.9% | 39.0% |
| Maximum | 98.2% | 100.0% |
| Range | 32.3% | 61.0% |
| Mean | 82.8% | 80.1% |
| Median | 83.7% | 80.6% |
| Interquartile 25% (IQ1) | 80.6% | 76.3% |
| Interquartile 75% (IQ3) | 86.8% | 84.0% |
| Interquartile Range (IQR) | 6.2% | 7.7% |
| Standard Deviation (Sample) | 6.0% | 11.5% |
| Standard Deviation (Population) | 6.0% | 11.5% |
Demographics Similar to Immigrants from Cuba and Americans by In Labor Force | Age 25-29
In terms of in labor force | age 25-29, the demographic groups most similar to Immigrants from Cuba are British West Indian (83.2%, a difference of 0.010%), Dominican (83.2%, a difference of 0.030%), African (83.2%, a difference of 0.050%), Immigrants from Dominican Republic (83.1%, a difference of 0.090%), and Immigrants from the Azores (83.1%, a difference of 0.10%). Similarly, the demographic groups most similar to Americans are Immigrants from the Azores (83.1%, a difference of 0.0%), Immigrants from Dominican Republic (83.1%, a difference of 0.010%), Nicaraguan (83.1%, a difference of 0.020%), Belizean (83.1%, a difference of 0.060%), and Dominican (83.2%, a difference of 0.070%).
| Demographics | Rating | Rank | In Labor Force | Age 25-29 |
| Basques | 0.0 /100 | #270 | Tragic 83.4% |
| Hondurans | 0.0 /100 | #271 | Tragic 83.4% |
| Immigrants | Caribbean | 0.0 /100 | #272 | Tragic 83.4% |
| Immigrants | Dominica | 0.0 /100 | #273 | Tragic 83.4% |
| Marshallese | 0.0 /100 | #274 | Tragic 83.3% |
| Samoans | 0.0 /100 | #275 | Tragic 83.3% |
| Immigrants | Honduras | 0.0 /100 | #276 | Tragic 83.3% |
| Africans | 0.0 /100 | #277 | Tragic 83.2% |
| Immigrants | Cuba | 0.0 /100 | #278 | Tragic 83.2% |
| British West Indians | 0.0 /100 | #279 | Tragic 83.2% |
| Dominicans | 0.0 /100 | #280 | Tragic 83.2% |
| Immigrants | Dominican Republic | 0.0 /100 | #281 | Tragic 83.1% |
| Americans | 0.0 /100 | #282 | Tragic 83.1% |
| Immigrants | Azores | 0.0 /100 | #283 | Tragic 83.1% |
| Nicaraguans | 0.0 /100 | #284 | Tragic 83.1% |
| Belizeans | 0.0 /100 | #285 | Tragic 83.1% |
| Mexican American Indians | 0.0 /100 | #286 | Tragic 83.0% |
| Guyanese | 0.0 /100 | #287 | Tragic 83.0% |
| Ottawa | 0.0 /100 | #288 | Tragic 83.0% |
| Immigrants | Micronesia | 0.0 /100 | #289 | Tragic 83.0% |
| Immigrants | Bangladesh | 0.0 /100 | #290 | Tragic 83.0% |