Immigrants from Cuba vs Seminole Receiving Food Stamps
COMPARE
Immigrants from Cuba
Seminole
Receiving Food Stamps
Receiving Food Stamps Comparison
Immigrants from Cuba
Seminole
20.8%
RECEIVING FOOD STAMPS
0.0/ 100
METRIC RATING
335th/ 347
METRIC RANK
14.8%
RECEIVING FOOD STAMPS
0.1/ 100
METRIC RATING
277th/ 347
METRIC RANK
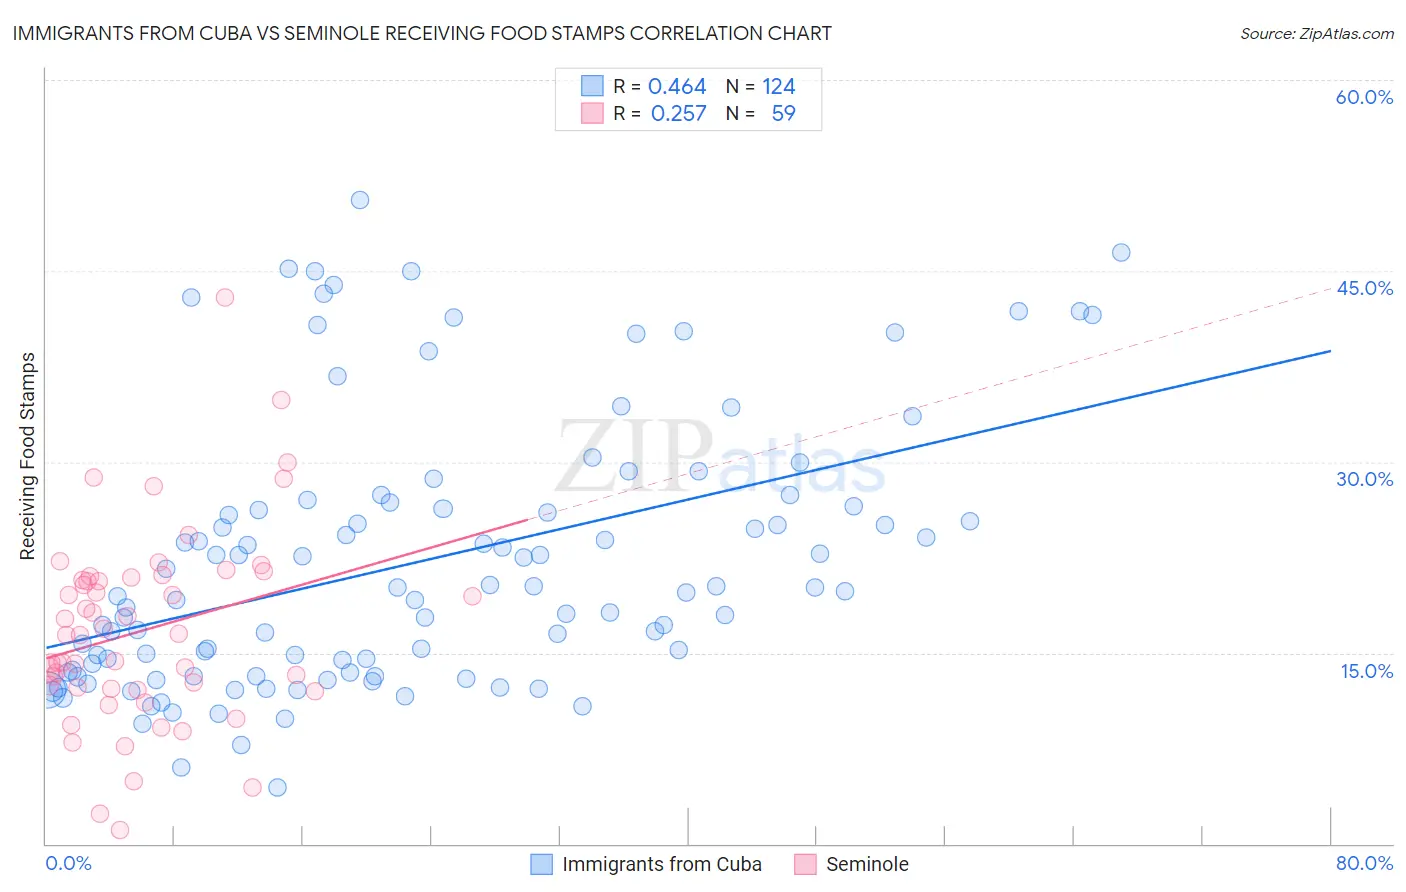
Immigrants from Cuba vs Seminole Receiving Food Stamps Correlation Chart
The statistical analysis conducted on geographies consisting of 325,340,789 people shows a moderate positive correlation between the proportion of Immigrants from Cuba and percentage of population receiving government assistance and/or food stamps in the United States with a correlation coefficient (R) of 0.464 and weighted average of 20.8%. Similarly, the statistical analysis conducted on geographies consisting of 118,279,359 people shows a weak positive correlation between the proportion of Seminole and percentage of population receiving government assistance and/or food stamps in the United States with a correlation coefficient (R) of 0.257 and weighted average of 14.8%, a difference of 40.6%.
Receiving Food Stamps Correlation Summary
| Measurement | Immigrants from Cuba | Seminole |
| Minimum | 4.5% | 1.1% |
| Maximum | 50.6% | 42.9% |
| Range | 46.1% | 41.8% |
| Mean | 22.1% | 16.8% |
| Median | 19.8% | 16.4% |
| Interquartile 25% (IQ1) | 13.5% | 12.2% |
| Interquartile 75% (IQ3) | 26.4% | 20.9% |
| Interquartile Range (IQR) | 12.9% | 8.7% |
| Standard Deviation (Sample) | 10.5% | 7.6% |
| Standard Deviation (Population) | 10.4% | 7.5% |
Similar Demographics by Receiving Food Stamps
Demographics Similar to Immigrants from Cuba by Receiving Food Stamps
In terms of receiving food stamps, the demographic groups most similar to Immigrants from Cuba are Navajo (21.1%, a difference of 1.1%), Cape Verdean (21.1%, a difference of 1.2%), Dominican (21.4%, a difference of 2.6%), Yakama (21.4%, a difference of 2.9%), and Yuman (20.2%, a difference of 2.9%).
| Demographics | Rating | Rank | Receiving Food Stamps |
| Colville | 0.0 /100 | #328 | Tragic 18.3% |
| Immigrants | Dominica | 0.0 /100 | #329 | Tragic 18.4% |
| Pima | 0.0 /100 | #330 | Tragic 19.0% |
| Immigrants | Caribbean | 0.0 /100 | #331 | Tragic 19.6% |
| Pueblo | 0.0 /100 | #332 | Tragic 19.9% |
| Inupiat | 0.0 /100 | #333 | Tragic 20.1% |
| Yuman | 0.0 /100 | #334 | Tragic 20.2% |
| Immigrants | Cuba | 0.0 /100 | #335 | Tragic 20.8% |
| Navajo | 0.0 /100 | #336 | Tragic 21.1% |
| Cape Verdeans | 0.0 /100 | #337 | Tragic 21.1% |
| Dominicans | 0.0 /100 | #338 | Tragic 21.4% |
| Yakama | 0.0 /100 | #339 | Tragic 21.4% |
| Tohono O'odham | 0.0 /100 | #340 | Tragic 21.5% |
| Hopi | 0.0 /100 | #341 | Tragic 21.6% |
| Immigrants | Yemen | 0.0 /100 | #342 | Tragic 21.6% |
Demographics Similar to Seminole by Receiving Food Stamps
In terms of receiving food stamps, the demographic groups most similar to Seminole are Liberian (14.8%, a difference of 0.050%), Belizean (14.8%, a difference of 0.13%), Kiowa (14.9%, a difference of 0.40%), Ecuadorian (14.9%, a difference of 0.45%), and Ute (14.7%, a difference of 0.76%).
| Demographics | Rating | Rank | Receiving Food Stamps |
| Mexicans | 0.1 /100 | #270 | Tragic 14.6% |
| Immigrants | Guatemala | 0.1 /100 | #271 | Tragic 14.6% |
| Chippewa | 0.1 /100 | #272 | Tragic 14.7% |
| Alaskan Athabascans | 0.1 /100 | #273 | Tragic 14.7% |
| Immigrants | Western Africa | 0.1 /100 | #274 | Tragic 14.7% |
| Ute | 0.1 /100 | #275 | Tragic 14.7% |
| Liberians | 0.1 /100 | #276 | Tragic 14.8% |
| Seminole | 0.1 /100 | #277 | Tragic 14.8% |
| Belizeans | 0.1 /100 | #278 | Tragic 14.8% |
| Kiowa | 0.0 /100 | #279 | Tragic 14.9% |
| Ecuadorians | 0.0 /100 | #280 | Tragic 14.9% |
| Spanish American Indians | 0.0 /100 | #281 | Tragic 14.9% |
| Immigrants | Central America | 0.0 /100 | #282 | Tragic 15.0% |
| Bangladeshis | 0.0 /100 | #283 | Tragic 15.0% |
| Immigrants | Ecuador | 0.0 /100 | #284 | Tragic 15.0% |