Immigrants from Cuba vs Moroccan In Labor Force | Age 25-29
COMPARE
Immigrants from Cuba
Moroccan
In Labor Force | Age 25-29
In Labor Force | Age 25-29 Comparison
Immigrants from Cuba
Moroccans
83.2%
IN LABOR FORCE | AGE 25-29
0.0/ 100
METRIC RATING
278th/ 347
METRIC RANK
84.5%
IN LABOR FORCE | AGE 25-29
32.6/ 100
METRIC RATING
189th/ 347
METRIC RANK
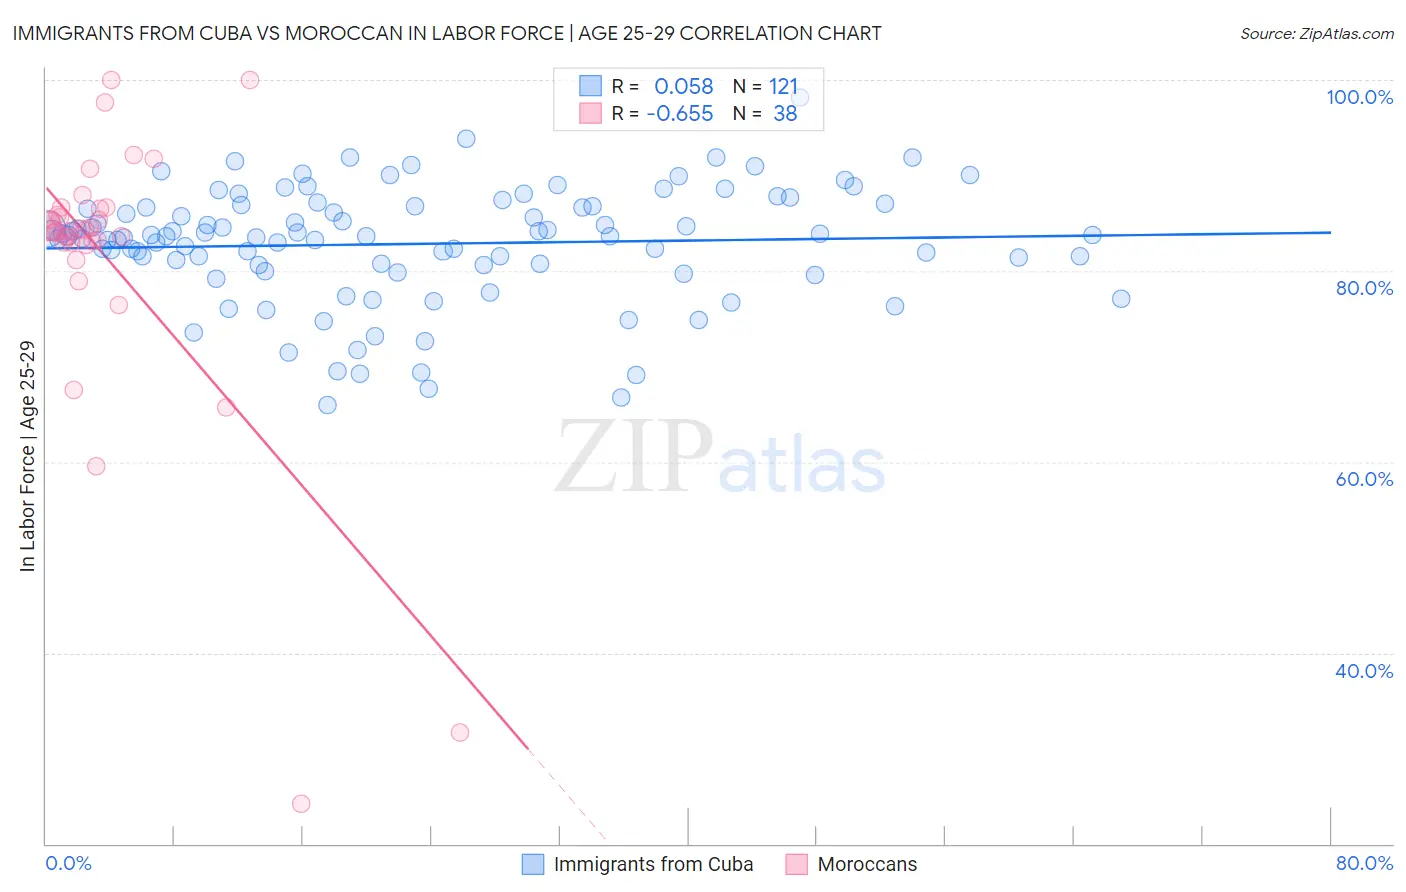
Immigrants from Cuba vs Moroccan In Labor Force | Age 25-29 Correlation Chart
The statistical analysis conducted on geographies consisting of 325,905,234 people shows a slight positive correlation between the proportion of Immigrants from Cuba and labor force participation rate among population between the ages 25 and 29 in the United States with a correlation coefficient (R) of 0.058 and weighted average of 83.2%. Similarly, the statistical analysis conducted on geographies consisting of 201,777,883 people shows a significant negative correlation between the proportion of Moroccans and labor force participation rate among population between the ages 25 and 29 in the United States with a correlation coefficient (R) of -0.655 and weighted average of 84.5%, a difference of 1.6%.
In Labor Force | Age 25-29 Correlation Summary
| Measurement | Immigrants from Cuba | Moroccan |
| Minimum | 65.9% | 24.2% |
| Maximum | 98.2% | 100.0% |
| Range | 32.3% | 75.8% |
| Mean | 82.8% | 81.2% |
| Median | 83.7% | 84.2% |
| Interquartile 25% (IQ1) | 80.6% | 83.0% |
| Interquartile 75% (IQ3) | 86.8% | 86.5% |
| Interquartile Range (IQR) | 6.2% | 3.5% |
| Standard Deviation (Sample) | 6.0% | 14.9% |
| Standard Deviation (Population) | 6.0% | 14.7% |
Similar Demographics by In Labor Force | Age 25-29
Demographics Similar to Immigrants from Cuba by In Labor Force | Age 25-29
In terms of in labor force | age 25-29, the demographic groups most similar to Immigrants from Cuba are British West Indian (83.2%, a difference of 0.010%), Dominican (83.2%, a difference of 0.030%), African (83.2%, a difference of 0.050%), Immigrants from Dominican Republic (83.1%, a difference of 0.090%), and American (83.1%, a difference of 0.10%).
| Demographics | Rating | Rank | In Labor Force | Age 25-29 |
| Hondurans | 0.0 /100 | #271 | Tragic 83.4% |
| Immigrants | Caribbean | 0.0 /100 | #272 | Tragic 83.4% |
| Immigrants | Dominica | 0.0 /100 | #273 | Tragic 83.4% |
| Marshallese | 0.0 /100 | #274 | Tragic 83.3% |
| Samoans | 0.0 /100 | #275 | Tragic 83.3% |
| Immigrants | Honduras | 0.0 /100 | #276 | Tragic 83.3% |
| Africans | 0.0 /100 | #277 | Tragic 83.2% |
| Immigrants | Cuba | 0.0 /100 | #278 | Tragic 83.2% |
| British West Indians | 0.0 /100 | #279 | Tragic 83.2% |
| Dominicans | 0.0 /100 | #280 | Tragic 83.2% |
| Immigrants | Dominican Republic | 0.0 /100 | #281 | Tragic 83.1% |
| Americans | 0.0 /100 | #282 | Tragic 83.1% |
| Immigrants | Azores | 0.0 /100 | #283 | Tragic 83.1% |
| Nicaraguans | 0.0 /100 | #284 | Tragic 83.1% |
| Belizeans | 0.0 /100 | #285 | Tragic 83.1% |
Demographics Similar to Moroccans by In Labor Force | Age 25-29
In terms of in labor force | age 25-29, the demographic groups most similar to Moroccans are Immigrants from Ukraine (84.5%, a difference of 0.010%), Welsh (84.5%, a difference of 0.010%), Immigrants from Belgium (84.6%, a difference of 0.020%), Immigrants from Portugal (84.6%, a difference of 0.020%), and Zimbabwean (84.5%, a difference of 0.030%).
| Demographics | Rating | Rank | In Labor Force | Age 25-29 |
| Europeans | 40.3 /100 | #182 | Average 84.6% |
| Scottish | 40.1 /100 | #183 | Average 84.6% |
| Immigrants | Kuwait | 38.2 /100 | #184 | Fair 84.6% |
| Immigrants | Denmark | 37.0 /100 | #185 | Fair 84.6% |
| Immigrants | Belgium | 35.0 /100 | #186 | Fair 84.6% |
| Immigrants | Portugal | 34.7 /100 | #187 | Fair 84.6% |
| Immigrants | Ukraine | 33.7 /100 | #188 | Fair 84.5% |
| Moroccans | 32.6 /100 | #189 | Fair 84.5% |
| Welsh | 31.1 /100 | #190 | Fair 84.5% |
| Zimbabweans | 28.7 /100 | #191 | Fair 84.5% |
| English | 25.8 /100 | #192 | Fair 84.5% |
| South American Indians | 25.0 /100 | #193 | Fair 84.5% |
| Portuguese | 21.2 /100 | #194 | Fair 84.4% |
| Immigrants | Israel | 20.8 /100 | #195 | Fair 84.4% |
| Immigrants | South Eastern Asia | 19.5 /100 | #196 | Poor 84.4% |