Immigrants from Cuba vs Native Hawaiian In Labor Force | Age 25-29
COMPARE
Immigrants from Cuba
Native Hawaiian
In Labor Force | Age 25-29
In Labor Force | Age 25-29 Comparison
Immigrants from Cuba
Native Hawaiians
83.2%
IN LABOR FORCE | AGE 25-29
0.0/ 100
METRIC RATING
278th/ 347
METRIC RANK
82.9%
IN LABOR FORCE | AGE 25-29
0.0/ 100
METRIC RATING
298th/ 347
METRIC RANK
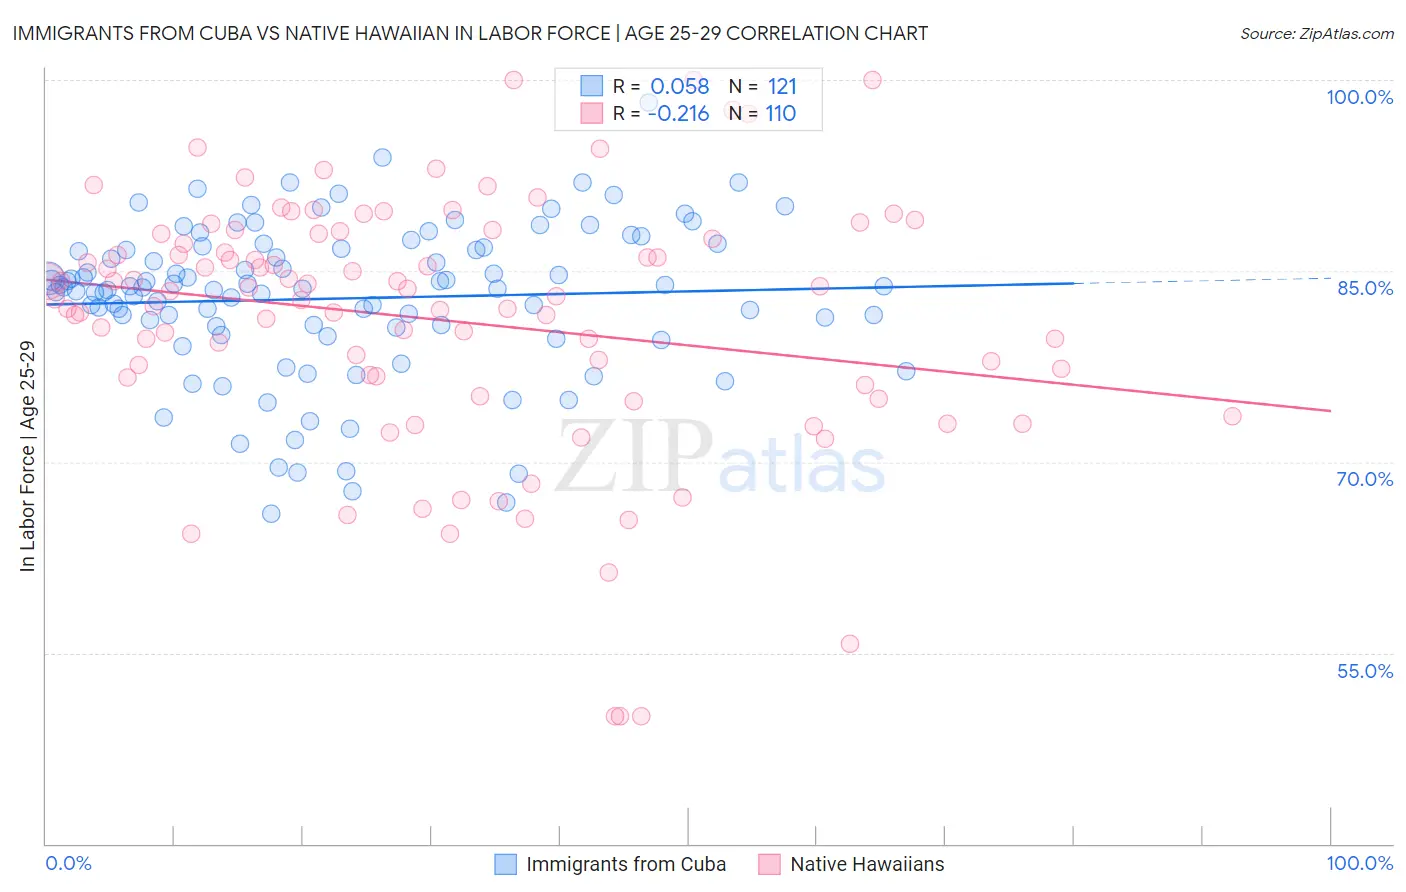
Immigrants from Cuba vs Native Hawaiian In Labor Force | Age 25-29 Correlation Chart
The statistical analysis conducted on geographies consisting of 325,905,234 people shows a slight positive correlation between the proportion of Immigrants from Cuba and labor force participation rate among population between the ages 25 and 29 in the United States with a correlation coefficient (R) of 0.058 and weighted average of 83.2%. Similarly, the statistical analysis conducted on geographies consisting of 332,007,245 people shows a weak negative correlation between the proportion of Native Hawaiians and labor force participation rate among population between the ages 25 and 29 in the United States with a correlation coefficient (R) of -0.216 and weighted average of 82.9%, a difference of 0.34%.
In Labor Force | Age 25-29 Correlation Summary
| Measurement | Immigrants from Cuba | Native Hawaiian |
| Minimum | 65.9% | 50.0% |
| Maximum | 98.2% | 100.0% |
| Range | 32.3% | 50.0% |
| Mean | 82.8% | 81.1% |
| Median | 83.7% | 83.2% |
| Interquartile 25% (IQ1) | 80.6% | 76.6% |
| Interquartile 75% (IQ3) | 86.8% | 87.9% |
| Interquartile Range (IQR) | 6.2% | 11.3% |
| Standard Deviation (Sample) | 6.0% | 10.1% |
| Standard Deviation (Population) | 6.0% | 10.1% |
Demographics Similar to Immigrants from Cuba and Native Hawaiians by In Labor Force | Age 25-29
In terms of in labor force | age 25-29, the demographic groups most similar to Immigrants from Cuba are British West Indian (83.2%, a difference of 0.010%), Dominican (83.2%, a difference of 0.030%), Immigrants from Dominican Republic (83.1%, a difference of 0.090%), American (83.1%, a difference of 0.10%), and Immigrants from the Azores (83.1%, a difference of 0.10%). Similarly, the demographic groups most similar to Native Hawaiians are Immigrants from Nicaragua (82.9%, a difference of 0.010%), Potawatomi (82.9%, a difference of 0.010%), Immigrants from Latin America (82.9%, a difference of 0.020%), Nepalese (82.9%, a difference of 0.020%), and Chippewa (82.9%, a difference of 0.020%).
| Demographics | Rating | Rank | In Labor Force | Age 25-29 |
| Immigrants | Cuba | 0.0 /100 | #278 | Tragic 83.2% |
| British West Indians | 0.0 /100 | #279 | Tragic 83.2% |
| Dominicans | 0.0 /100 | #280 | Tragic 83.2% |
| Immigrants | Dominican Republic | 0.0 /100 | #281 | Tragic 83.1% |
| Americans | 0.0 /100 | #282 | Tragic 83.1% |
| Immigrants | Azores | 0.0 /100 | #283 | Tragic 83.1% |
| Nicaraguans | 0.0 /100 | #284 | Tragic 83.1% |
| Belizeans | 0.0 /100 | #285 | Tragic 83.1% |
| Mexican American Indians | 0.0 /100 | #286 | Tragic 83.0% |
| Guyanese | 0.0 /100 | #287 | Tragic 83.0% |
| Ottawa | 0.0 /100 | #288 | Tragic 83.0% |
| Immigrants | Micronesia | 0.0 /100 | #289 | Tragic 83.0% |
| Immigrants | Bangladesh | 0.0 /100 | #290 | Tragic 83.0% |
| Hawaiians | 0.0 /100 | #291 | Tragic 83.0% |
| Immigrants | Guyana | 0.0 /100 | #292 | Tragic 83.0% |
| Immigrants | Latin America | 0.0 /100 | #293 | Tragic 82.9% |
| Nepalese | 0.0 /100 | #294 | Tragic 82.9% |
| Chippewa | 0.0 /100 | #295 | Tragic 82.9% |
| Immigrants | Nicaragua | 0.0 /100 | #296 | Tragic 82.9% |
| Potawatomi | 0.0 /100 | #297 | Tragic 82.9% |
| Native Hawaiians | 0.0 /100 | #298 | Tragic 82.9% |