Immigrants from Northern Europe vs Immigrants from Yemen In Labor Force | Age > 16
COMPARE
Immigrants from Northern Europe
Immigrants from Yemen
In Labor Force | Age > 16
In Labor Force | Age > 16 Comparison
Immigrants from Northern Europe
Immigrants from Yemen
64.7%
IN LABOR FORCE | AGE > 16
7.2/ 100
METRIC RATING
231st/ 347
METRIC RANK
59.6%
IN LABOR FORCE | AGE > 16
0.0/ 100
METRIC RATING
338th/ 347
METRIC RANK
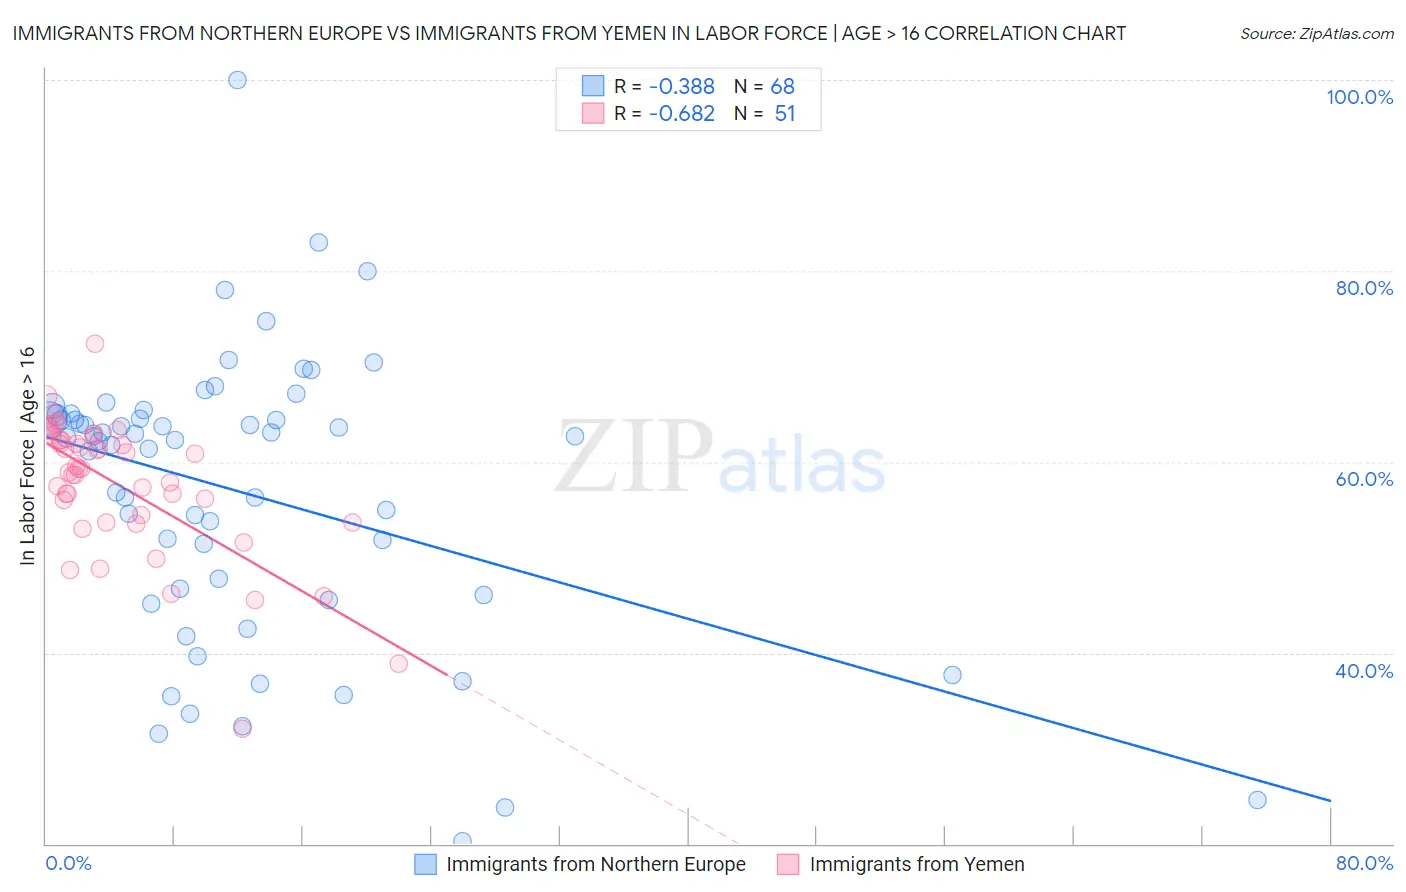
Immigrants from Northern Europe vs Immigrants from Yemen In Labor Force | Age > 16 Correlation Chart
The statistical analysis conducted on geographies consisting of 477,244,389 people shows a mild negative correlation between the proportion of Immigrants from Northern Europe and labor force participation rate among population ages 16 and over in the United States with a correlation coefficient (R) of -0.388 and weighted average of 64.7%. Similarly, the statistical analysis conducted on geographies consisting of 82,433,611 people shows a significant negative correlation between the proportion of Immigrants from Yemen and labor force participation rate among population ages 16 and over in the United States with a correlation coefficient (R) of -0.682 and weighted average of 59.6%, a difference of 8.4%.
In Labor Force | Age > 16 Correlation Summary
| Measurement | Immigrants from Northern Europe | Immigrants from Yemen |
| Minimum | 20.3% | 32.0% |
| Maximum | 100.0% | 72.4% |
| Range | 79.7% | 40.4% |
| Mean | 56.8% | 57.6% |
| Median | 62.4% | 59.3% |
| Interquartile 25% (IQ1) | 46.4% | 53.7% |
| Interquartile 75% (IQ3) | 64.7% | 62.3% |
| Interquartile Range (IQR) | 18.3% | 8.6% |
| Standard Deviation (Sample) | 14.9% | 7.2% |
| Standard Deviation (Population) | 14.8% | 7.2% |
Similar Demographics by In Labor Force | Age > 16
Demographics Similar to Immigrants from Northern Europe by In Labor Force | Age > 16
In terms of in labor force | age > 16, the demographic groups most similar to Immigrants from Northern Europe are British (64.7%, a difference of 0.0%), Chinese (64.7%, a difference of 0.0%), European (64.7%, a difference of 0.040%), Polish (64.7%, a difference of 0.040%), and Northern European (64.7%, a difference of 0.040%).
| Demographics | Rating | Rank | In Labor Force | Age > 16 |
| Immigrants | Jamaica | 8.8 /100 | #224 | Tragic 64.7% |
| Croatians | 8.8 /100 | #225 | Tragic 64.7% |
| Europeans | 8.3 /100 | #226 | Tragic 64.7% |
| Poles | 8.3 /100 | #227 | Tragic 64.7% |
| Northern Europeans | 8.2 /100 | #228 | Tragic 64.7% |
| British | 7.3 /100 | #229 | Tragic 64.7% |
| Chinese | 7.3 /100 | #230 | Tragic 64.7% |
| Immigrants | Northern Europe | 7.2 /100 | #231 | Tragic 64.7% |
| Africans | 5.8 /100 | #232 | Tragic 64.6% |
| Slavs | 4.9 /100 | #233 | Tragic 64.6% |
| Vietnamese | 4.7 /100 | #234 | Tragic 64.6% |
| Austrians | 4.6 /100 | #235 | Tragic 64.6% |
| Immigrants | Norway | 4.6 /100 | #236 | Tragic 64.6% |
| Italians | 4.6 /100 | #237 | Tragic 64.6% |
| Lebanese | 3.9 /100 | #238 | Tragic 64.5% |
Demographics Similar to Immigrants from Yemen by In Labor Force | Age > 16
In terms of in labor force | age > 16, the demographic groups most similar to Immigrants from Yemen are Houma (59.5%, a difference of 0.25%), Colville (59.8%, a difference of 0.27%), Pueblo (59.3%, a difference of 0.64%), Menominee (60.6%, a difference of 1.5%), and Native/Alaskan (60.6%, a difference of 1.6%).
| Demographics | Rating | Rank | In Labor Force | Age > 16 |
| Ute | 0.0 /100 | #331 | Tragic 60.9% |
| Crow | 0.0 /100 | #332 | Tragic 60.8% |
| Paiute | 0.0 /100 | #333 | Tragic 60.7% |
| Apache | 0.0 /100 | #334 | Tragic 60.7% |
| Natives/Alaskans | 0.0 /100 | #335 | Tragic 60.6% |
| Menominee | 0.0 /100 | #336 | Tragic 60.6% |
| Colville | 0.0 /100 | #337 | Tragic 59.8% |
| Immigrants | Yemen | 0.0 /100 | #338 | Tragic 59.6% |
| Houma | 0.0 /100 | #339 | Tragic 59.5% |
| Pueblo | 0.0 /100 | #340 | Tragic 59.3% |
| Hopi | 0.0 /100 | #341 | Tragic 58.4% |
| Puerto Ricans | 0.0 /100 | #342 | Tragic 58.1% |
| Yuman | 0.0 /100 | #343 | Tragic 57.8% |
| Pima | 0.0 /100 | #344 | Tragic 57.4% |
| Tohono O'odham | 0.0 /100 | #345 | Tragic 57.2% |