Immigrants from Armenia vs Immigrants from Yemen In Labor Force | Age > 16
COMPARE
Immigrants from Armenia
Immigrants from Yemen
In Labor Force | Age > 16
In Labor Force | Age > 16 Comparison
Immigrants from Armenia
Immigrants from Yemen
65.3%
IN LABOR FORCE | AGE > 16
76.6/ 100
METRIC RATING
155th/ 347
METRIC RANK
59.6%
IN LABOR FORCE | AGE > 16
0.0/ 100
METRIC RATING
338th/ 347
METRIC RANK
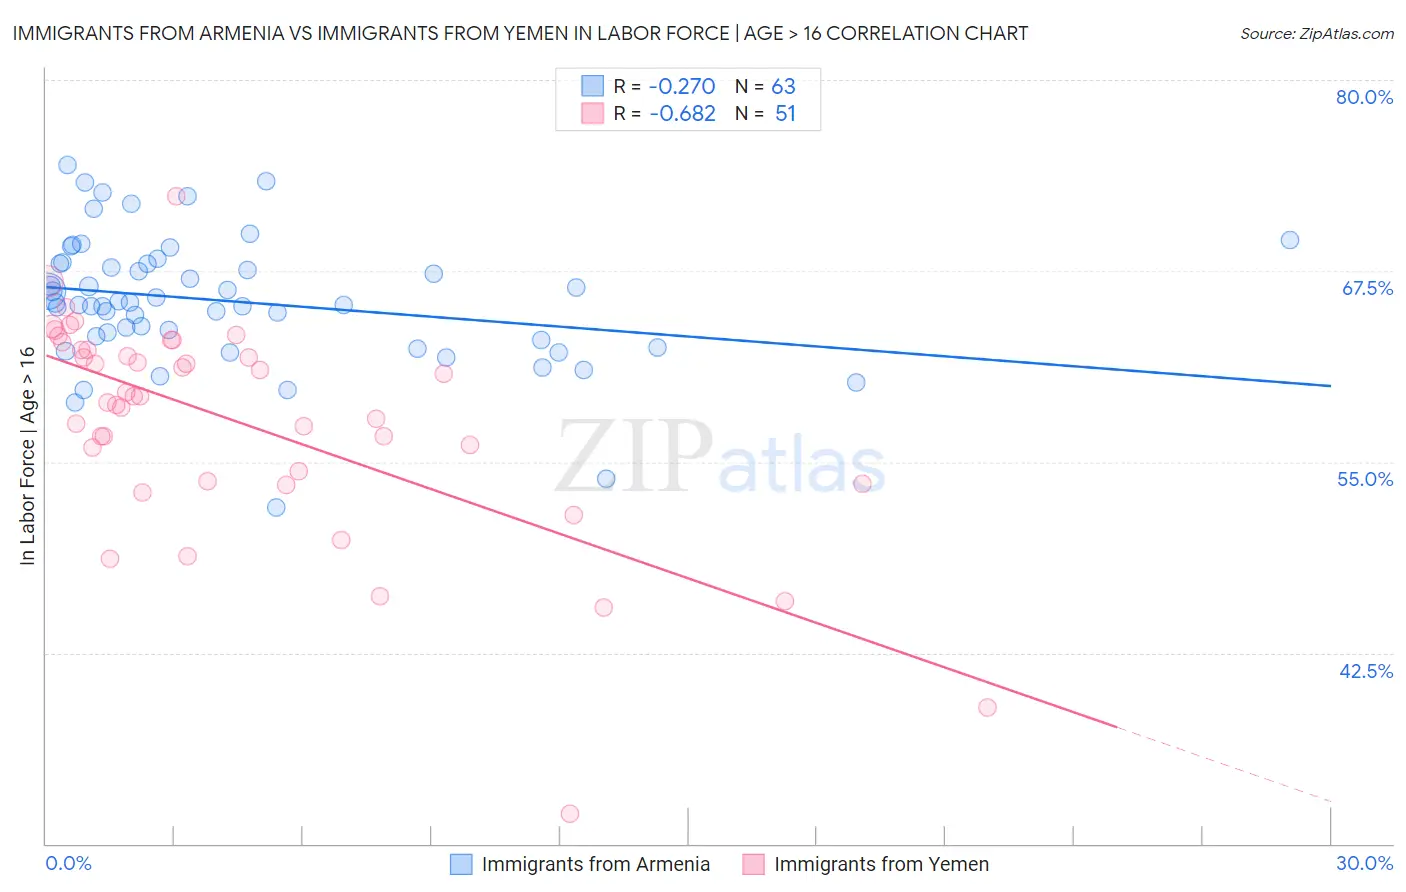
Immigrants from Armenia vs Immigrants from Yemen In Labor Force | Age > 16 Correlation Chart
The statistical analysis conducted on geographies consisting of 97,718,343 people shows a weak negative correlation between the proportion of Immigrants from Armenia and labor force participation rate among population ages 16 and over in the United States with a correlation coefficient (R) of -0.270 and weighted average of 65.3%. Similarly, the statistical analysis conducted on geographies consisting of 82,433,611 people shows a significant negative correlation between the proportion of Immigrants from Yemen and labor force participation rate among population ages 16 and over in the United States with a correlation coefficient (R) of -0.682 and weighted average of 59.6%, a difference of 9.5%.
In Labor Force | Age > 16 Correlation Summary
| Measurement | Immigrants from Armenia | Immigrants from Yemen |
| Minimum | 52.0% | 32.0% |
| Maximum | 74.4% | 72.4% |
| Range | 22.4% | 40.4% |
| Mean | 65.5% | 57.6% |
| Median | 65.4% | 59.3% |
| Interquartile 25% (IQ1) | 63.0% | 53.7% |
| Interquartile 75% (IQ3) | 68.0% | 62.3% |
| Interquartile Range (IQR) | 5.0% | 8.6% |
| Standard Deviation (Sample) | 4.3% | 7.2% |
| Standard Deviation (Population) | 4.2% | 7.2% |
Similar Demographics by In Labor Force | Age > 16
Demographics Similar to Immigrants from Armenia by In Labor Force | Age > 16
In terms of in labor force | age > 16, the demographic groups most similar to Immigrants from Armenia are Immigrants from Ireland (65.3%, a difference of 0.010%), Immigrants from Russia (65.3%, a difference of 0.010%), Panamanian (65.3%, a difference of 0.020%), Immigrants from Eastern Europe (65.4%, a difference of 0.030%), and Immigrants from Syria (65.3%, a difference of 0.030%).
| Demographics | Rating | Rank | In Labor Force | Age > 16 |
| Bhutanese | 86.3 /100 | #148 | Excellent 65.5% |
| Immigrants | Albania | 85.7 /100 | #149 | Excellent 65.4% |
| Immigrants | Immigrants | 81.9 /100 | #150 | Excellent 65.4% |
| Czechs | 81.5 /100 | #151 | Excellent 65.4% |
| Yugoslavians | 81.3 /100 | #152 | Excellent 65.4% |
| Immigrants | China | 80.5 /100 | #153 | Excellent 65.4% |
| Immigrants | Eastern Europe | 78.3 /100 | #154 | Good 65.4% |
| Immigrants | Armenia | 76.6 /100 | #155 | Good 65.3% |
| Immigrants | Ireland | 75.9 /100 | #156 | Good 65.3% |
| Immigrants | Russia | 75.7 /100 | #157 | Good 65.3% |
| Panamanians | 75.2 /100 | #158 | Good 65.3% |
| Immigrants | Syria | 74.6 /100 | #159 | Good 65.3% |
| Immigrants | South Africa | 73.5 /100 | #160 | Good 65.3% |
| Australians | 71.3 /100 | #161 | Good 65.3% |
| Albanians | 70.8 /100 | #162 | Good 65.3% |
Demographics Similar to Immigrants from Yemen by In Labor Force | Age > 16
In terms of in labor force | age > 16, the demographic groups most similar to Immigrants from Yemen are Houma (59.5%, a difference of 0.25%), Colville (59.8%, a difference of 0.27%), Pueblo (59.3%, a difference of 0.64%), Menominee (60.6%, a difference of 1.5%), and Native/Alaskan (60.6%, a difference of 1.6%).
| Demographics | Rating | Rank | In Labor Force | Age > 16 |
| Ute | 0.0 /100 | #331 | Tragic 60.9% |
| Crow | 0.0 /100 | #332 | Tragic 60.8% |
| Paiute | 0.0 /100 | #333 | Tragic 60.7% |
| Apache | 0.0 /100 | #334 | Tragic 60.7% |
| Natives/Alaskans | 0.0 /100 | #335 | Tragic 60.6% |
| Menominee | 0.0 /100 | #336 | Tragic 60.6% |
| Colville | 0.0 /100 | #337 | Tragic 59.8% |
| Immigrants | Yemen | 0.0 /100 | #338 | Tragic 59.6% |
| Houma | 0.0 /100 | #339 | Tragic 59.5% |
| Pueblo | 0.0 /100 | #340 | Tragic 59.3% |
| Hopi | 0.0 /100 | #341 | Tragic 58.4% |
| Puerto Ricans | 0.0 /100 | #342 | Tragic 58.1% |
| Yuman | 0.0 /100 | #343 | Tragic 57.8% |
| Pima | 0.0 /100 | #344 | Tragic 57.4% |
| Tohono O'odham | 0.0 /100 | #345 | Tragic 57.2% |