Paiute vs Immigrants from Yemen In Labor Force | Age > 16
COMPARE
Paiute
Immigrants from Yemen
In Labor Force | Age > 16
In Labor Force | Age > 16 Comparison
Paiute
Immigrants from Yemen
60.7%
IN LABOR FORCE | AGE > 16
0.0/ 100
METRIC RATING
333rd/ 347
METRIC RANK
59.6%
IN LABOR FORCE | AGE > 16
0.0/ 100
METRIC RATING
338th/ 347
METRIC RANK
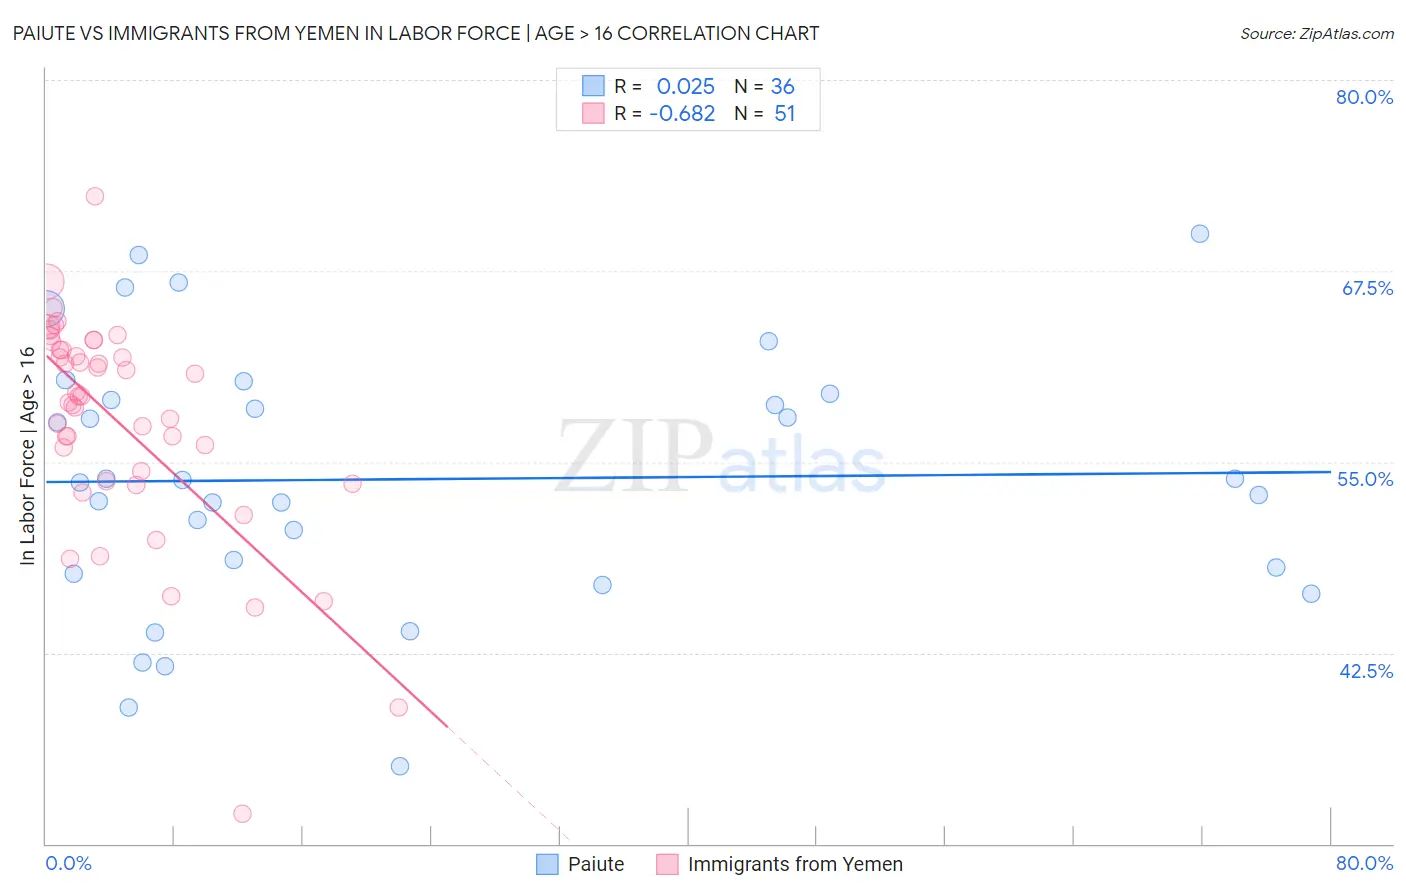
Paiute vs Immigrants from Yemen In Labor Force | Age > 16 Correlation Chart
The statistical analysis conducted on geographies consisting of 58,401,251 people shows no correlation between the proportion of Paiute and labor force participation rate among population ages 16 and over in the United States with a correlation coefficient (R) of 0.025 and weighted average of 60.7%. Similarly, the statistical analysis conducted on geographies consisting of 82,433,611 people shows a significant negative correlation between the proportion of Immigrants from Yemen and labor force participation rate among population ages 16 and over in the United States with a correlation coefficient (R) of -0.682 and weighted average of 59.6%, a difference of 1.8%.
In Labor Force | Age > 16 Correlation Summary
| Measurement | Paiute | Immigrants from Yemen |
| Minimum | 35.1% | 32.0% |
| Maximum | 69.9% | 72.4% |
| Range | 34.8% | 40.4% |
| Mean | 53.9% | 57.6% |
| Median | 53.7% | 59.3% |
| Interquartile 25% (IQ1) | 47.9% | 53.7% |
| Interquartile 75% (IQ3) | 59.2% | 62.3% |
| Interquartile Range (IQR) | 11.4% | 8.6% |
| Standard Deviation (Sample) | 8.5% | 7.2% |
| Standard Deviation (Population) | 8.4% | 7.2% |
Demographics Similar to Paiute and Immigrants from Yemen by In Labor Force | Age > 16
In terms of in labor force | age > 16, the demographic groups most similar to Paiute are Apache (60.7%, a difference of 0.050%), Crow (60.8%, a difference of 0.080%), Native/Alaskan (60.6%, a difference of 0.23%), Ute (60.9%, a difference of 0.26%), and Menominee (60.6%, a difference of 0.26%). Similarly, the demographic groups most similar to Immigrants from Yemen are Houma (59.5%, a difference of 0.25%), Colville (59.8%, a difference of 0.27%), Pueblo (59.3%, a difference of 0.64%), Menominee (60.6%, a difference of 1.5%), and Native/Alaskan (60.6%, a difference of 1.6%).
| Demographics | Rating | Rank | In Labor Force | Age > 16 |
| Cherokee | 0.0 /100 | #325 | Tragic 61.9% |
| Sioux | 0.0 /100 | #326 | Tragic 61.8% |
| Cajuns | 0.0 /100 | #327 | Tragic 61.8% |
| Dutch West Indians | 0.0 /100 | #328 | Tragic 61.7% |
| Choctaw | 0.0 /100 | #329 | Tragic 61.5% |
| Creek | 0.0 /100 | #330 | Tragic 61.3% |
| Ute | 0.0 /100 | #331 | Tragic 60.9% |
| Crow | 0.0 /100 | #332 | Tragic 60.8% |
| Paiute | 0.0 /100 | #333 | Tragic 60.7% |
| Apache | 0.0 /100 | #334 | Tragic 60.7% |
| Natives/Alaskans | 0.0 /100 | #335 | Tragic 60.6% |
| Menominee | 0.0 /100 | #336 | Tragic 60.6% |
| Colville | 0.0 /100 | #337 | Tragic 59.8% |
| Immigrants | Yemen | 0.0 /100 | #338 | Tragic 59.6% |
| Houma | 0.0 /100 | #339 | Tragic 59.5% |
| Pueblo | 0.0 /100 | #340 | Tragic 59.3% |
| Hopi | 0.0 /100 | #341 | Tragic 58.4% |
| Puerto Ricans | 0.0 /100 | #342 | Tragic 58.1% |
| Yuman | 0.0 /100 | #343 | Tragic 57.8% |
| Pima | 0.0 /100 | #344 | Tragic 57.4% |
| Tohono O'odham | 0.0 /100 | #345 | Tragic 57.2% |