Black/African American vs Immigrants from Cameroon In Labor Force | Age > 16
COMPARE
Black/African American
Immigrants from Cameroon
In Labor Force | Age > 16
In Labor Force | Age > 16 Comparison
Blacks/African Americans
Immigrants from Cameroon
63.4%
IN LABOR FORCE | AGE > 16
0.0/ 100
METRIC RATING
306th/ 347
METRIC RANK
68.7%
IN LABOR FORCE | AGE > 16
100.0/ 100
METRIC RATING
7th/ 347
METRIC RANK
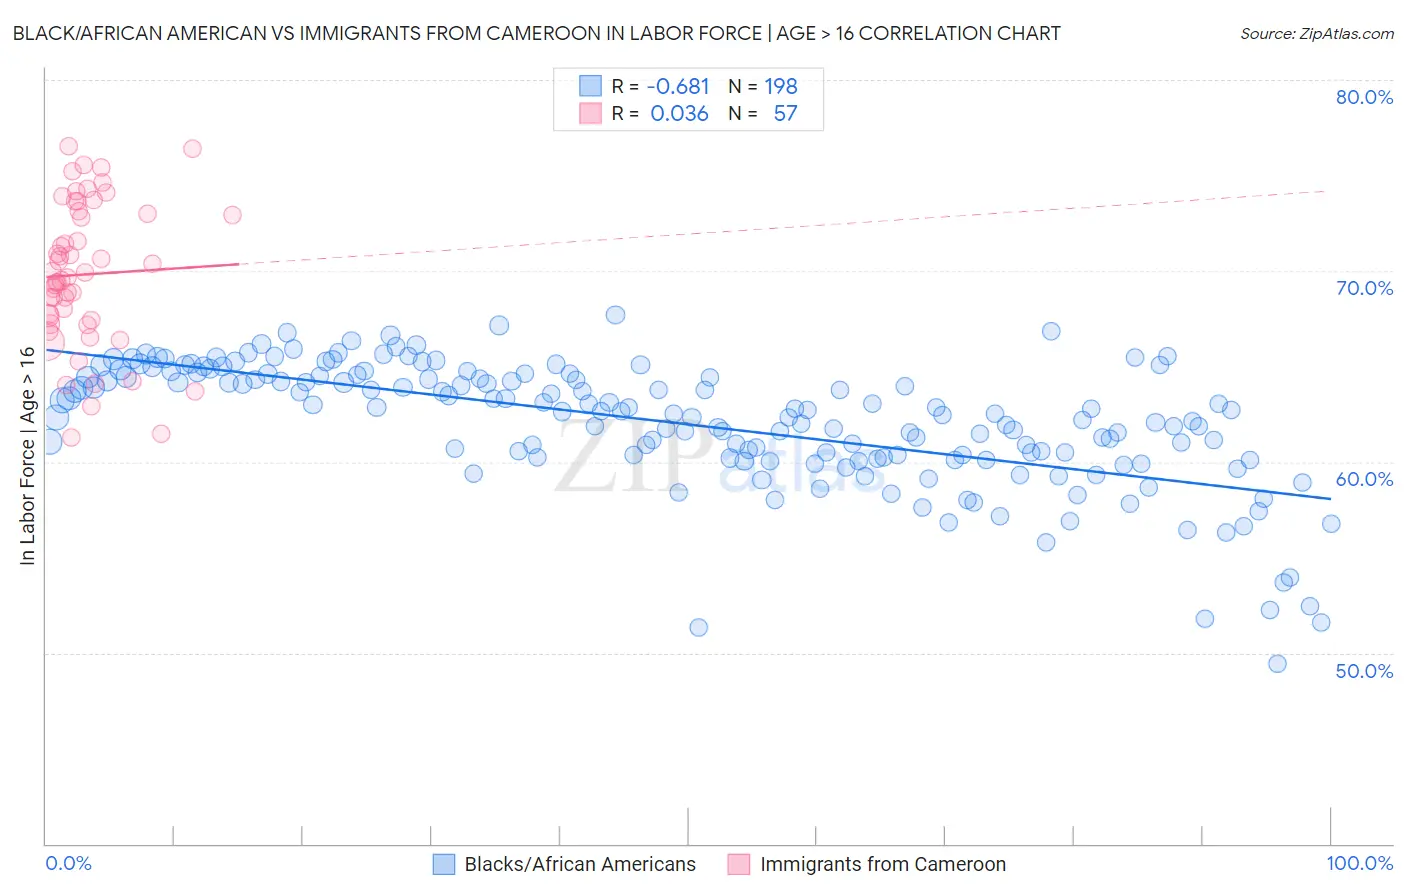
Black/African American vs Immigrants from Cameroon In Labor Force | Age > 16 Correlation Chart
The statistical analysis conducted on geographies consisting of 566,016,902 people shows a significant negative correlation between the proportion of Blacks/African Americans and labor force participation rate among population ages 16 and over in the United States with a correlation coefficient (R) of -0.681 and weighted average of 63.4%. Similarly, the statistical analysis conducted on geographies consisting of 130,760,472 people shows no correlation between the proportion of Immigrants from Cameroon and labor force participation rate among population ages 16 and over in the United States with a correlation coefficient (R) of 0.036 and weighted average of 68.7%, a difference of 8.3%.
In Labor Force | Age > 16 Correlation Summary
| Measurement | Black/African American | Immigrants from Cameroon |
| Minimum | 49.4% | 61.3% |
| Maximum | 67.7% | 76.5% |
| Range | 18.2% | 15.3% |
| Mean | 62.0% | 69.8% |
| Median | 62.6% | 69.7% |
| Interquartile 25% (IQ1) | 60.2% | 67.3% |
| Interquartile 75% (IQ3) | 64.5% | 73.1% |
| Interquartile Range (IQR) | 4.2% | 5.7% |
| Standard Deviation (Sample) | 3.3% | 3.8% |
| Standard Deviation (Population) | 3.3% | 3.8% |
Similar Demographics by In Labor Force | Age > 16
Demographics Similar to Blacks/African Americans by In Labor Force | Age > 16
In terms of in labor force | age > 16, the demographic groups most similar to Blacks/African Americans are Central American Indian (63.4%, a difference of 0.030%), Pennsylvania German (63.4%, a difference of 0.080%), Osage (63.5%, a difference of 0.090%), Nonimmigrants (63.5%, a difference of 0.14%), and Cree (63.5%, a difference of 0.19%).
| Demographics | Rating | Rank | In Labor Force | Age > 16 |
| Whites/Caucasians | 0.0 /100 | #299 | Tragic 63.6% |
| Immigrants | Azores | 0.0 /100 | #300 | Tragic 63.6% |
| Spanish Americans | 0.0 /100 | #301 | Tragic 63.6% |
| Delaware | 0.0 /100 | #302 | Tragic 63.6% |
| Cree | 0.0 /100 | #303 | Tragic 63.5% |
| Immigrants | Nonimmigrants | 0.0 /100 | #304 | Tragic 63.5% |
| Osage | 0.0 /100 | #305 | Tragic 63.5% |
| Blacks/African Americans | 0.0 /100 | #306 | Tragic 63.4% |
| Central American Indians | 0.0 /100 | #307 | Tragic 63.4% |
| Pennsylvania Germans | 0.0 /100 | #308 | Tragic 63.4% |
| Scotch-Irish | 0.0 /100 | #309 | Tragic 63.3% |
| Shoshone | 0.0 /100 | #310 | Tragic 63.2% |
| Blackfeet | 0.0 /100 | #311 | Tragic 63.2% |
| Iroquois | 0.0 /100 | #312 | Tragic 63.2% |
| Chippewa | 0.0 /100 | #313 | Tragic 63.1% |
Demographics Similar to Immigrants from Cameroon by In Labor Force | Age > 16
In terms of in labor force | age > 16, the demographic groups most similar to Immigrants from Cameroon are Immigrants from Eritrea (68.9%, a difference of 0.25%), Sierra Leonean (68.9%, a difference of 0.30%), Immigrants from Sierra Leone (68.5%, a difference of 0.32%), Immigrants from Eastern Africa (68.5%, a difference of 0.33%), and Immigrants from Bolivia (68.4%, a difference of 0.36%).
| Demographics | Rating | Rank | In Labor Force | Age > 16 |
| Immigrants | Ethiopia | 100.0 /100 | #1 | Exceptional 69.4% |
| Ethiopians | 100.0 /100 | #2 | Exceptional 69.3% |
| Somalis | 100.0 /100 | #3 | Exceptional 69.2% |
| Immigrants | Somalia | 100.0 /100 | #4 | Exceptional 69.1% |
| Sierra Leoneans | 100.0 /100 | #5 | Exceptional 68.9% |
| Immigrants | Eritrea | 100.0 /100 | #6 | Exceptional 68.9% |
| Immigrants | Cameroon | 100.0 /100 | #7 | Exceptional 68.7% |
| Immigrants | Sierra Leone | 100.0 /100 | #8 | Exceptional 68.5% |
| Immigrants | Eastern Africa | 100.0 /100 | #9 | Exceptional 68.5% |
| Immigrants | Bolivia | 100.0 /100 | #10 | Exceptional 68.4% |
| Bolivians | 100.0 /100 | #11 | Exceptional 68.2% |
| Sudanese | 100.0 /100 | #12 | Exceptional 68.0% |
| Immigrants | Nepal | 100.0 /100 | #13 | Exceptional 68.0% |
| Liberians | 100.0 /100 | #14 | Exceptional 67.8% |
| Immigrants | Middle Africa | 100.0 /100 | #15 | Exceptional 67.7% |